
Water Transport Characteristics of Multiple Structures of Xylem Vessels in Magnolia

School of Hydraulic and Electric Power, Heilongjiang University, Harbin 150080, China
*
Author to whom correspondence should be addressed.
Forests 2022, 13(10), 1617; https://doi.org/10.3390/f13101617
Submission received: 21 August 2022
/
Revised: 28 September 2022
/
Accepted: 29 September 2022
/
Published: 2 October 2022
(This article belongs to the Special Issue Xylem Water Distribution in Woody Plants Visualized)
Abstract
:The multiple structures of xylem vessels in Magnolia provide stable and efficient water transport channels. The structural parameters of xylem vessels were studied in wood sections and in macerated materials. The results showed that the xylem vessels of Magnolia contained a helical thickening structure and a pit structure of a secondary wall, and the end walls had a scalariform perforation plate. The helical thickening and scalariform perforation plate increased the flow resistance of the vessel, and the pit structure decreased the flow resistance of the vessel. There was a close positive correlation between the flow resistance of the vessels and the helical width, the helical height, the thickness of the scalariform perforation plate, the number of holes in the scalariform perforation plate, the length of the pit canal, and the pit spacing. In addition, there was a negative correlation between the flow resistance of the vessels and the helical spacing, the pit vertical diameter, and the pit domain length. Among these structural parameters, the helical height, the number of holes, and the length of pit canal had a greater influence on the flow resistance. The pit structure caused the vessel to produce radial water transport. The radial transmission efficiency increased with the increase in the pit domain length. With no pit membrane in the pit structure of Magnolia, the radial transmission efficiency would be between 43.99% and 53.21%.
1. Introduction
Water is the medium for physiological and biochemical reactions and for transporting substances in plants, and water transport is an important part of plant water absorption and transpiration [1,2,3,4]. The soil–plant–atmosphere continuum (SPAC) forms a unified, dynamic continuous feedback system. Water potential acts as an indicator of the unified energy in SPAC systems to integrate different media and different interfaces into a unified continuum. As a channel of water transport, plant xylem plays a role in material transport and mechanical support [5,6]. Xylem vessels, including the secondary thickening structure, scalariform perforation plates, and other structures, form a staggered piping system and provide a low-resistance channel for water transport, which ensures the safe and efficient transportation of water in the xylem [7,8].
The vessel structure is tiny, the internal flow is complex, and water transport efficiency directly affects the physiological activities of plants. Jacobsen et al. [9] found that xylem cells with thickened walls play an important role in improving the water conductivity and anti-embolism of the vessel via centrifuge measurements. Christman et al. [10] measured the flow resistance of a single vessel and analyzed the influencing characteristics of the scalariform perforation plate structure on the flow resistance. Jansen and Tixier et al. [11,12] anatomically observed the properties of the pit membrane and found that with an increase in pit membrane thickness, both the porosities of the pit membrane and the degree of mechanical deformation damage were reduced.
The xylem structure is more difficult to measure, because it is measured in micrometer and millimeter [13]. Many scholars have studied the flow mechanism of the xylem vessel microstructure using computational fluid dynamics (CFD). Schulte [14] used FIDAP software to simulate water flow in the scalariform perforation plate of the xylem vessel and analyzed the resistance ratio of the scalariform perforation plate to water transmission in the vessel. Xu et al. [15] analyzed the water conveyance characteristics of the xylem vessels of Jatropha curcas and found that smooth vessel resistance accounts for the largest proportion of the total resistance. Chen et al. [16] used the SST k-ε model to simulate the flow of annular and helical thickening on the inner wall of the vessel, and the structural flow resistance of the annular thickening vessel was greater than that of helical thickening under the same inner diameter.
Most studies have focused on the effect of a single structure such as secondary wall thickening or the scalariform perforation plate on xylem water transport rather than the coordinated transportation of multiple structures in the xylem. Magnolia can be used as an ornamental tree species in gardens as well as for furniture, construction, plywood, and other materials [17]. The water transfer efficiency of Magnolia xylem was found to affect the plant’s growth and development [18]. This paper took Magnolia as the research object and conducted anatomical experiments and numerical simulations combined with scanning electron microscope (SEM) observations and the acquisition of multiple structural parameters of xylem vessels. Moreover, it analyzed the distribution law of the flow field inside the vessel and the influence of the parameters on the flow characteristics, which revealed the mechanism of a multi-functional water transport system in the plant xylem.
2. Materials and Methods
2.1. Experimental Materials of Magnolia
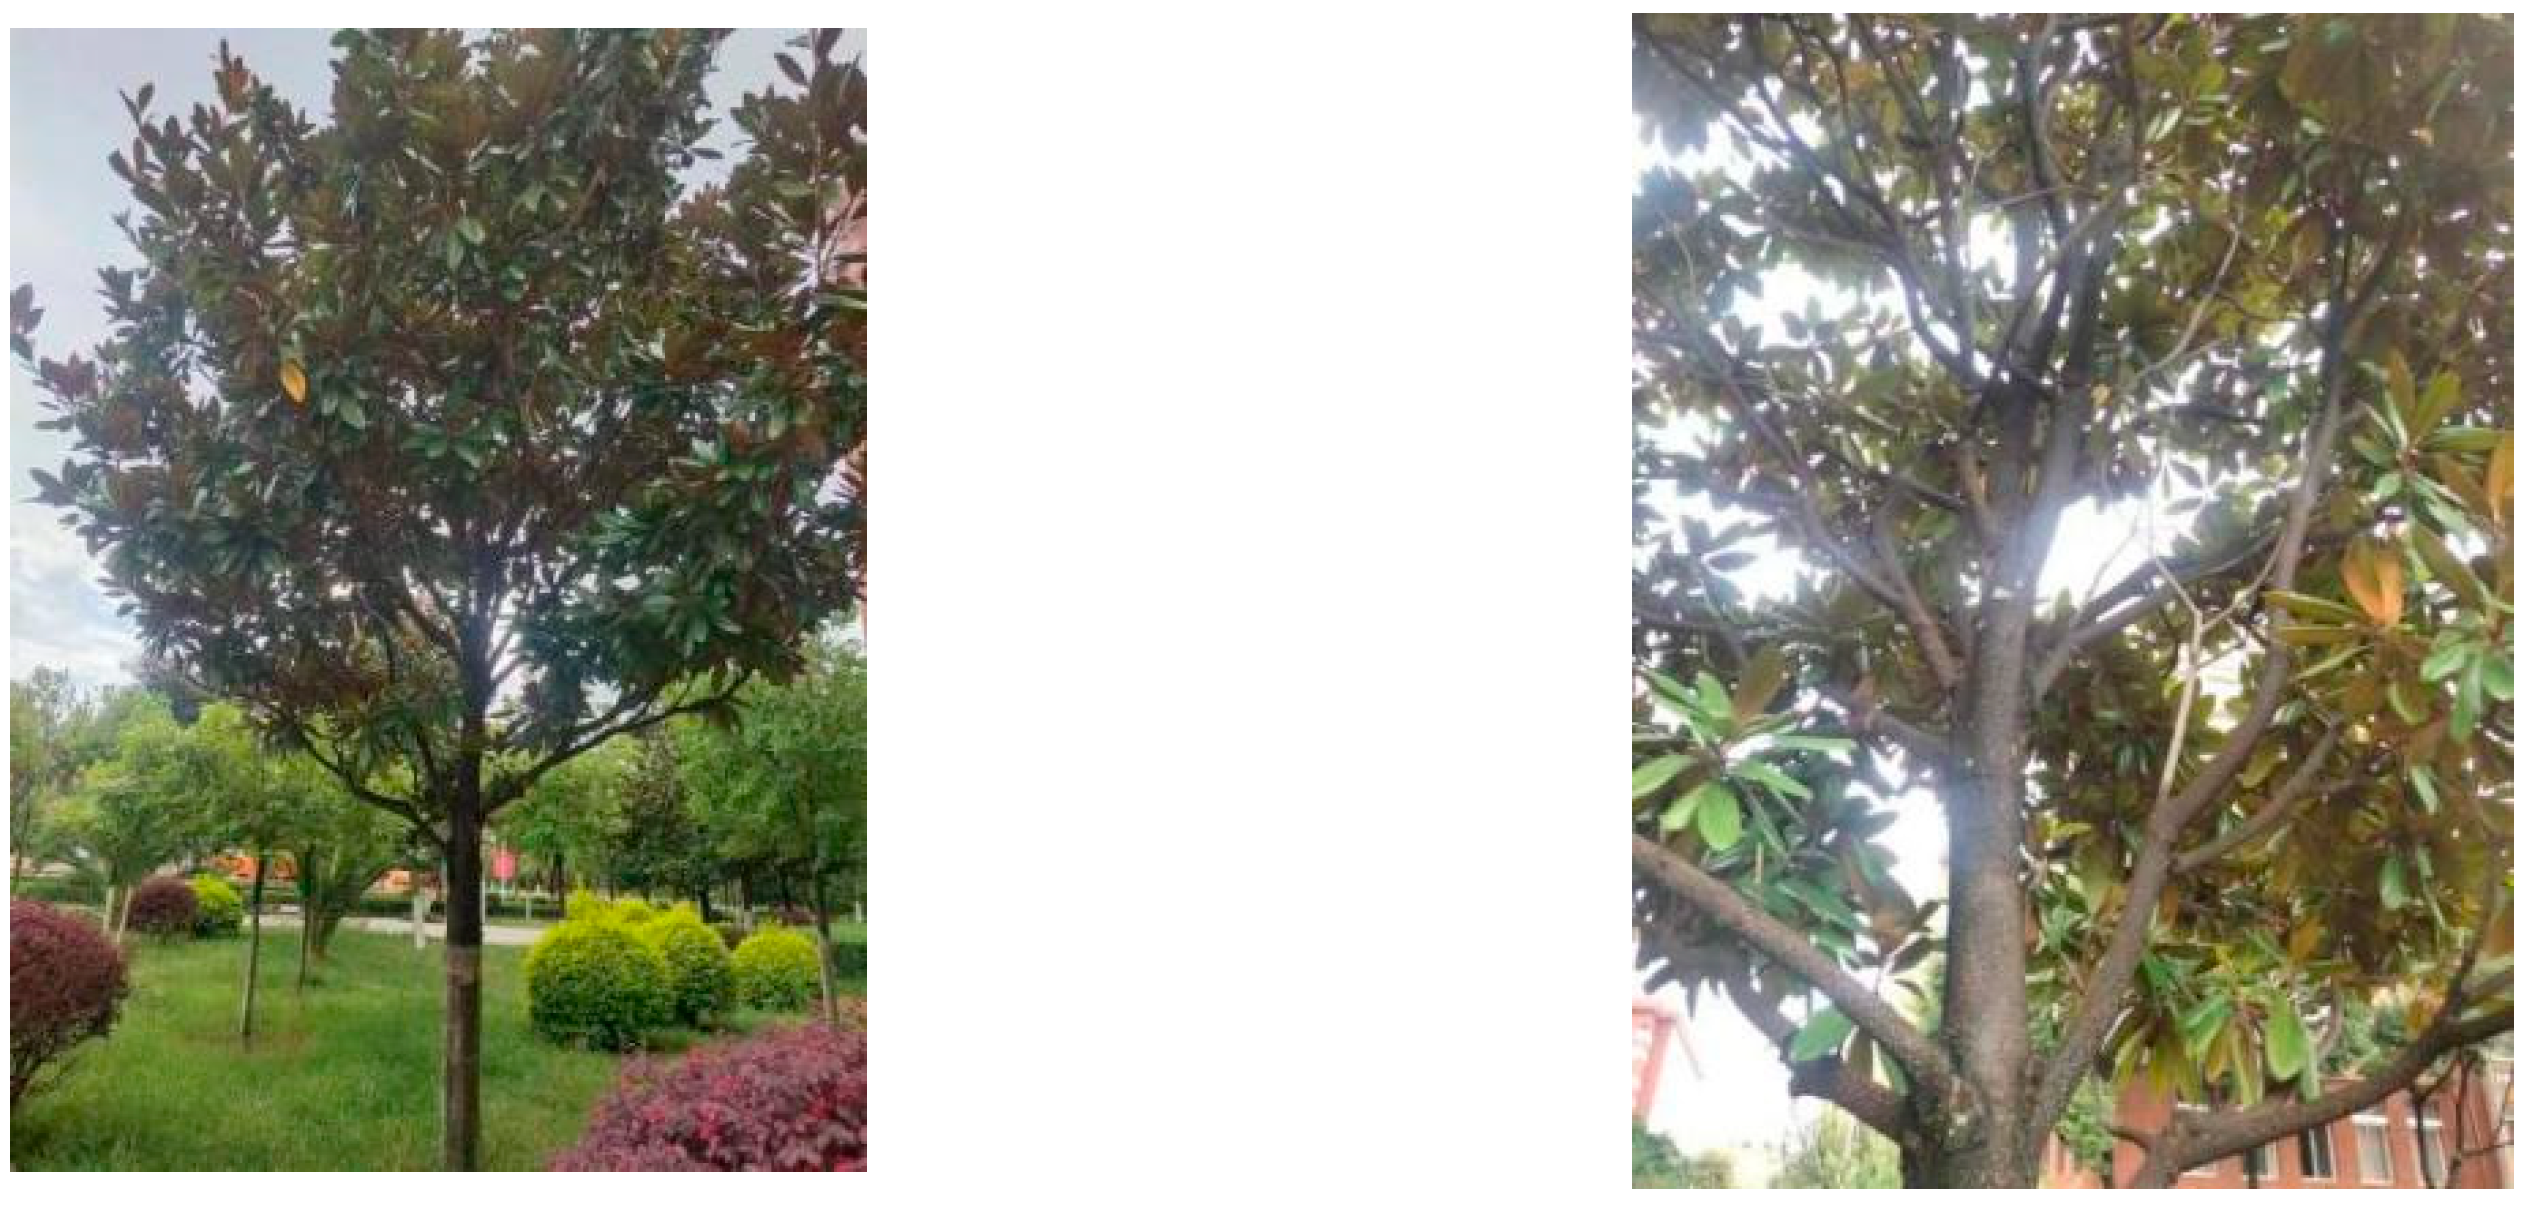
In our study, Magnolia sp. was collected at the Southwest Forestry University, Yunnan Province, Southwest China, at 25°05′73″ N and 102°75′55″ E, 1800 m above sea level. This area belongs to the northern subtropical monsoon climate zone. The samples were taken from a five-year-old Magnolia individual, and 3–5 branches with a target diameter range (0.8–1.0 cm) were randomly collected. The height of the tree was about 5 m, and its stems and leaves grew densely (Figure 1). The collected samples were sealed in black plastic bags, sliced within 2 days and observed by a scanning electron microscope and a digital microscope [15]. We measured morphological features of xylem vessels to establish the basic structural parameters for our model. At this stage, we did not aim to provide statistical data on the natural variability of xylem vessel morphology in Magnolia.
2.2. Structural Parameters and Model Construction
The stems of Magnolia were sawn into 0.6 × 0.6 × 0.6 cm blocks, and the wood was softened via a boiling vacuum water bath and then sliced with a sliding microtome (Leica, 2000R, Leica Microsystems, Shanghai, China). The slices included cross-sections and axial sections, and the thickness of the sections was generally 20 to 30 μm. The sectioned samples were preserved using a clearing agent (ethanol–glycerol absolute volume ratio, 1:1). The sliced samples were dehydrated with 30%, 50%, 70%, 90%, and 100% ethanol for 30 min each and then sprayed with gold using a vacuum ion sputtering instrument (Agar Scientific, B7340, Hezao Lab, Beijing, China). The samples were fixed on the observation platform with a conductive glue, the observation space was vacuum sealed, and the xylem structures were observed via a tungsten filament scanning electron microscope (Zeiss, EVO MA 15, Carl Zeiss AG, Shanghai, China). The cross-section of the sample (Figure 2a) was used to observe the length of the pit canal, the helical height, and the wall thickness of the vessel. The axial section of the sample (Figure 2b) was used to observe the pit vertical diameter, the pit horizontal diameter, the helical width, the helical spacing, and the pit spacing.
The macerated samples were obtained from the same material as the sliced samples. The branches of Magnolia were sawed into 0.2 × 0.2 × 1.5 cm wood strips and placed in a mixture of 30% hydrogen peroxide and glacial acetic acid (v:v, 1:1) for heating in a water bath. The wood strips turned white and then cooled down; distilled water was added several times, and the test tube was shaken to separate the wood strips. The macerated tissue fluid was placed on a glass slide and observed under a bio-digital microscope (Nikon, ECLIPSE 80i, Henghao Instruments, Shanghai, China) (Figure 3a). The length of the vessel, the inner diameter of the vessel, and the structural parameters of the scalariform perforation plate were observed. Three measurements were obtained for each structural parameter and then averaged. The standard deviation of each structural parameter was between 0.08 and 5.72. The geometry parameters of the xylem vessel microstructure of Magnolia are shown in Table 1. The prediction model construction was based on the geometric parameters of the vessel structure, using SolidWorks software to establish the three-dimensional solid model of the equal-scale vessel, as shown in Figure 3b.
In Figure 3b, l is the vessel length, n is the length of the straight section at the outlet and the inlet, d is the inner diameter of the vessel, f is the pit domain length, h is the helical height, a is the helical width, b is the helical spacing, c is the pit vertical diameter, r is the pit spacing, e is the length of pit canal, θ is the inclination of the scalariform perforation plate, and t is the thickness of the scalariform perforation plate.
2.3. Governing Equation and Boundary Conditions
The governing equations of water transport in xylem vessels were described by the conservation of mass and momentum, which are expressed as [19]:
- (1)
- Mass conservation equation:
- (2)
- Momentum conservation equation:
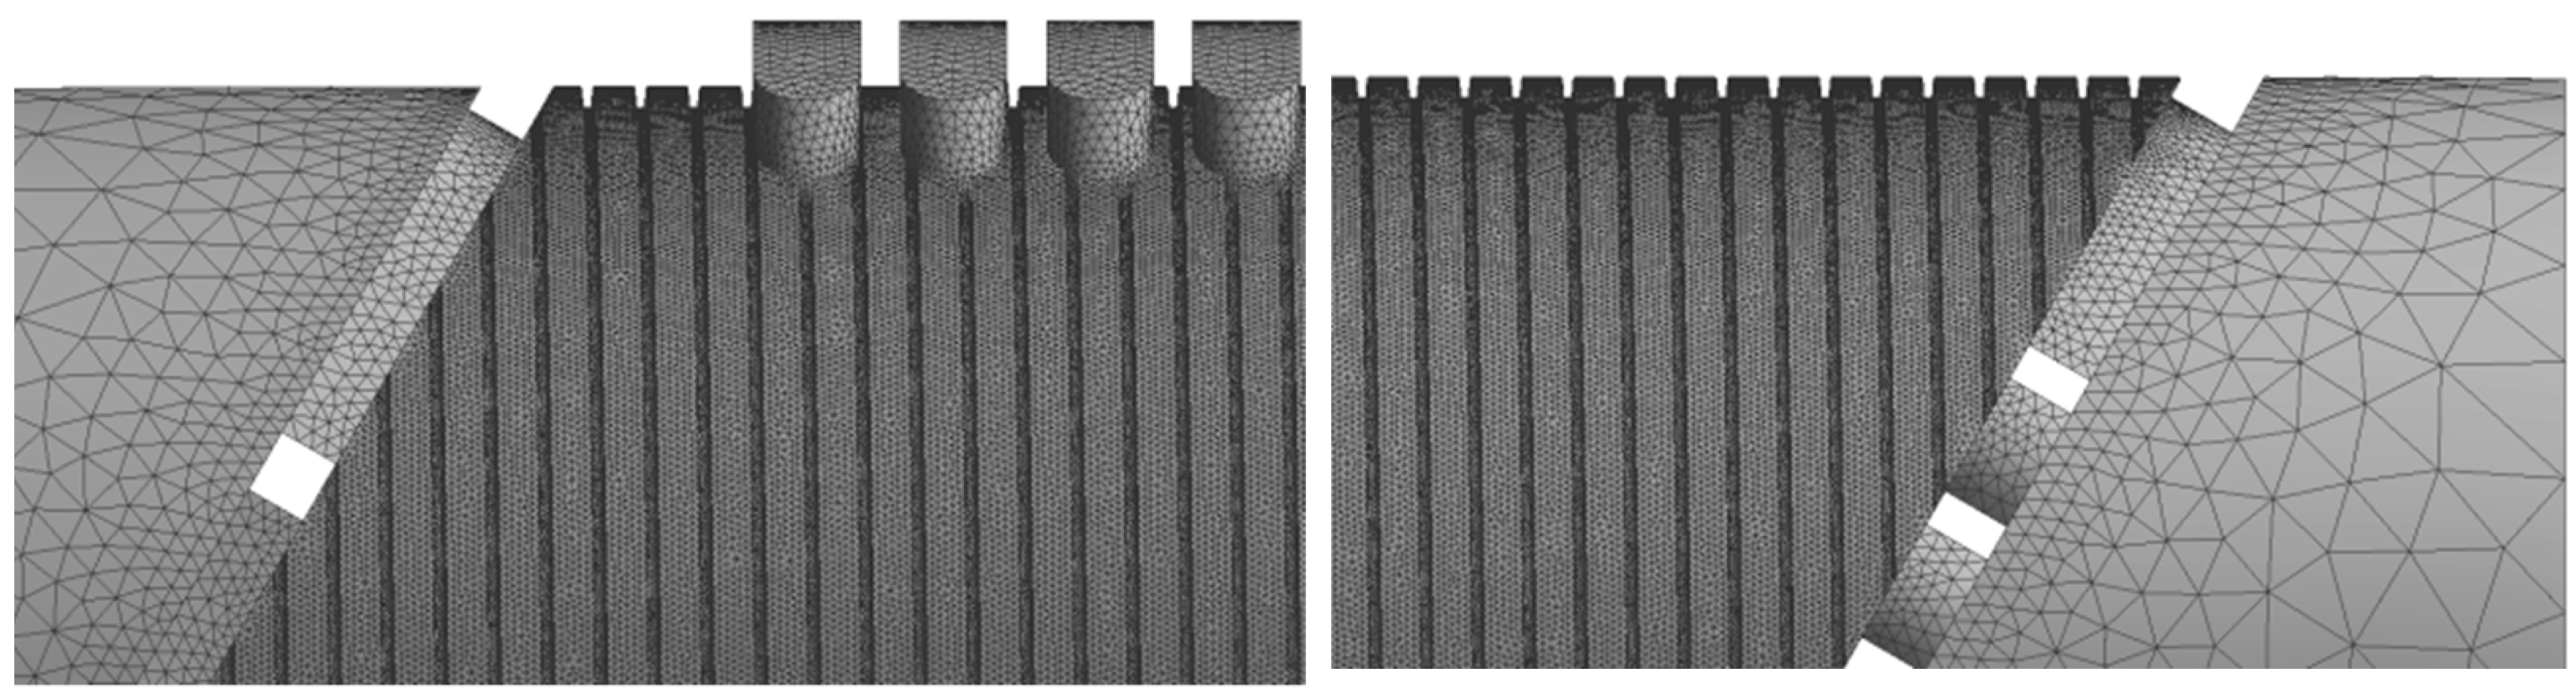
For the boundary conditions, the irregularity of the vessel structure was generated by tetrahedral and hexahedral unstructured meshes. The total number of grids was 4.3592 million, the maximum grid size of the element was 3.047 × 10⁻⁵ m, and the minimum grid size of the element was 0.4 × 10⁻⁶ m (Figure 4). For the initial conditions, the pressure at the outlet of the model was zero, and the velocity at the inlet of the model was 0.3 mm/s [15,16,20,21]. The straight sections with a length of 50 μm were added to both ends of the vessel to avoid the influence of the inlet and the outlet. The detailed steps of the computational-domain model are shown in Figure 5.
3. Results
3.1. Flow Velocity and Pressure Distribution Inside Xylem Vessels
The flow characteristics and the pressure distribution of the Magnolia vessel are shown in Figure 6. The velocities and the pressures are represented by different colors, from blue to red, and the velocity and the pressure were gradually increased. The flow velocity and the pressures at each point of the vessel did not represent the absolute velocity, and the relative velocity comparison at each point was feasible. The inlet scalariform perforation plate of the vessel reduced the cross-section of the water, and the flow velocity increased with the fluid flow through the scalariform perforation plate (Figure 6a). The pit structure caused a radial flow in the vessel, and the flow velocity was distributed in a gradient along the radial direction. The flow velocity in the central axis was the largest, which gradually decreased to both sides. The flow velocity at the outlet of the pit structure was low. The scalariform perforation plate at the outlet of the vessel had large apertures at the upper and lower ends and small apertures in the middle, which meant that the fluid flowing through the scalariform perforation plate area had a large flow velocity near the walls at both ends in the radial direction and a small flow velocity at the radial center. It can be seen from Figure 6b that the inlet pressure of the vessel was the largest and the pressure at the front and rear ends of the scalariform perforation plate varied greatly. The pit structure without pit membranes led to an increase in the equivalent inner diameter, which reduced the pressure of the vessel. The equivalent inner diameter decreased and the pressure increased after the pit area. The helical thickening obstructed the flow, causing a pressure difference before and after the thickening structure, and the pressure drop on both sides of the helical protrusion was obvious.
3.2. Influence of the Flow Resistance of Each Structure on the Vessel
The influences of the helical thickening, the scalariform perforation plate, and the pit structure on the flow resistance of the Magnolia vessel were studied. Based on the smooth vessel, the helical thickening, the scalariform perforation plate, and the pit structure were superimposed onto the previous model in turn. The flow resistance of the vessel was simulated and analyzed, and the pressure drop (Δp) and the flow rate (q) of the Magnolia vessel were calculated. The flow resistance was calculated by dividing the pressure drop (Δp) by the flow rate (q) [7]. The results are shown in Table 2.
The flow resistance of the smooth vessel was 0.620 × 10¹² Pa·s·m−3. The flow resistance was 0.683 × 10¹² Pa·s·m−3 after adding the helical thickening structure, and the flow resistance was increased by 10%. The flow resistance was 1.171 × 10¹² Pa·s·m−3 after adding the scalariform perforation plate structure, and the flow resistance was increased by 71%. The flow resistance was 0.528 × 10¹² Pa·s·m−3 after adding the pit structure without membranes, and the flow resistance was reduced by 55%.
3.3. Flow Resistance Characteristics of the Vessel Structure
3.3.1. Influence of the Helical Thickening Structure on the Flow Resistance
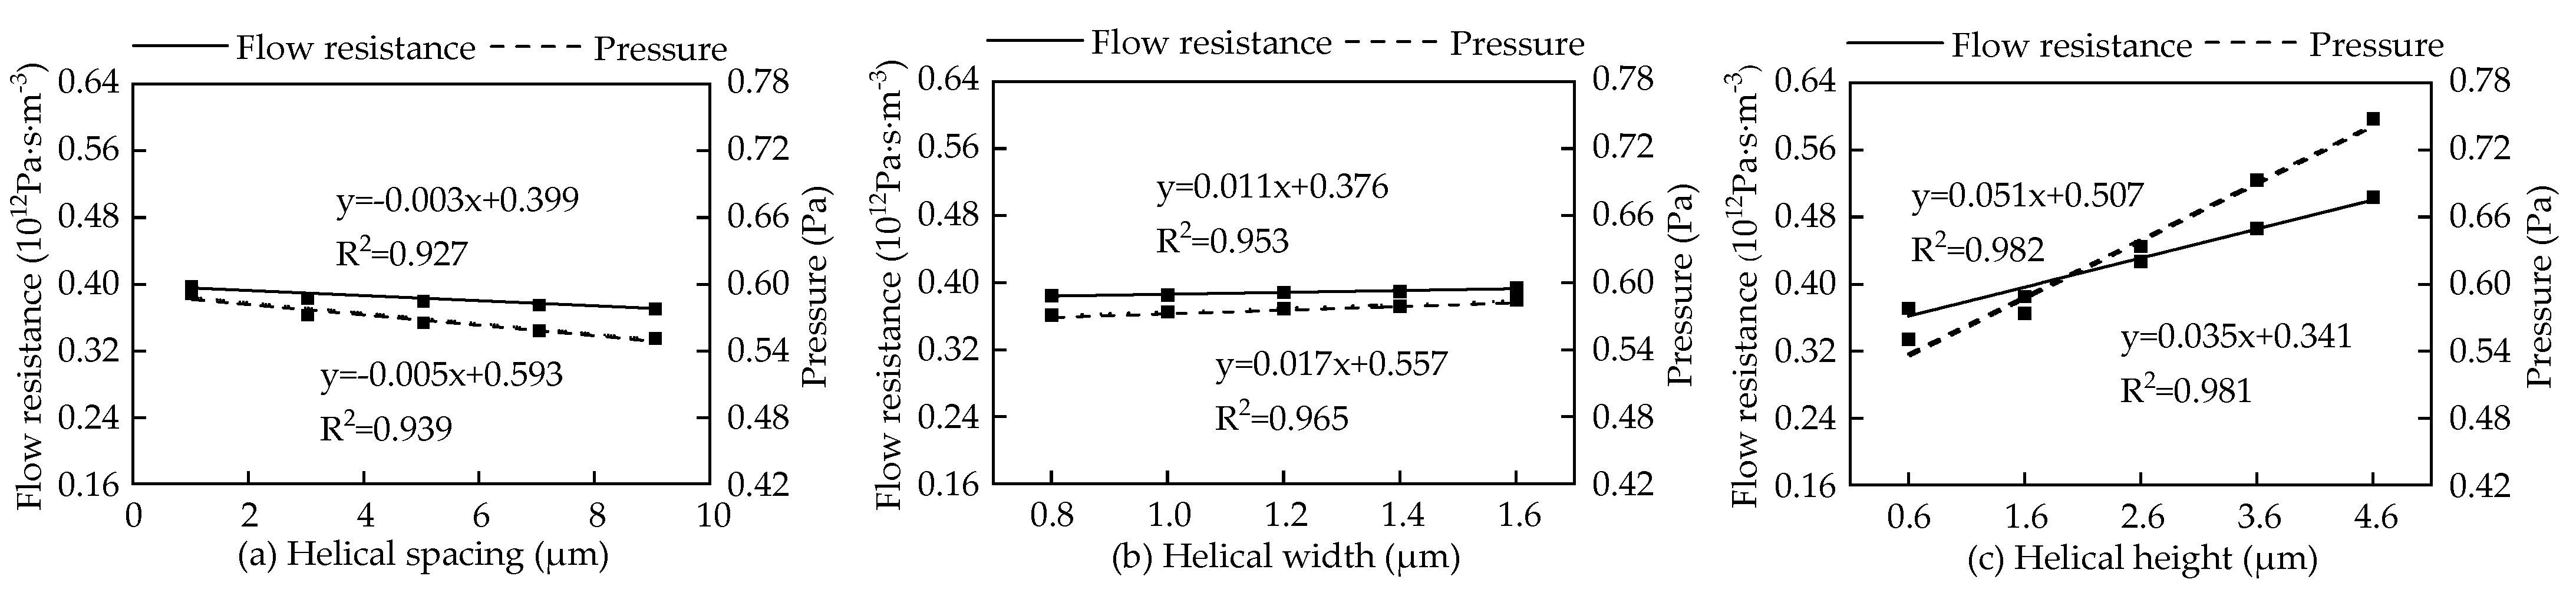
It can be seen from Figure 7 that the flow resistance and the pressure drop (Δp) had a near linear relationship with the helical spacing, the helical width, and the helical height; the determination coefficients (R2) were 0.927 (0.939), 0.953 (0.965), and 0.981 (0.982), respectively, indicating that the equations were fitted well.
The flow resistance increased with the increase in helical width and helical height and decreased with the increase in helical spacing. The parameters of the other structures of the vessel remained unchanged. When the helical spacing was increased by 1 to 9 μm, the flow rate (q) was stable at 1.49 × 10⁻¹² m3/s, the total pressure drop (Δp) decreased from 0.593 to 0.553 Pa and the flow resistance decreased from 0.399 × 10¹² to 0.373 × 10¹² Pa·s·m−3, which decreased by 6.6%. When the helical width increased from 0.8 to 1.6 μm, the flow rate (q) was stable at 1.49 × 10⁻¹² m3/s, the total pressure drop (Δp) increased from 0.571 to 0.585 Pa and the flow resistance increased from 0.385 × 10¹² to 0.394 × 10¹² Pa·s·m−3, which increased by 2.3%. When the helical height increased from 0.6 to 4.6 μm, the flow rate (q) was stable at 1.49 × 10⁻¹² m3/s, the total pressure drop (Δp) increased from 0.551 to 0.748 Pa and the flow resistance increased from 0.371 × 10¹² to 0.504 × 10¹² Pa·s·m−3, which increased by 35.7%.
3.3.2. Influence of the Scalariform Perforation Plate Structure on the Flow Resistance
The scalariform perforation plate structure at the front of the vessel was analyzed, and it can be seen from Figure 8 that the flow resistance and the pressure drop (Δp) had a near linear relationship with the thickness, the inclination angle, and the number of holes; the coefficients of determination (R2) were 0.999 (0.999), 0.964 (0.964), 0.893 (0.901), and 0.957 (0.956), indicating that the equations were fitted well. The flow resistance increased with the increase in the thickness and the number of holes, decreasing first and then increasing with an increase in the inclination angle. The parameters of the other structures of the vessel remained unchanged. When the thickness of the scalariform perforation plate increased from 1 to 9 μm, the flow rate (q) was stable at 1.49 × 10⁻¹² m3/s, the total pressure drop (Δp) increased from 0.503 to 0.643 Pa and the flow resistance increased from 0.338 × 10¹² to 0.432 × 10¹² Pa·s·m−3, which increased by 27.7%. When the inclination angle increased from 50° to 60°, the flow rate (q) was stable at 1.49 × 10⁻¹² m3/s, the total pressure drop (Δp) first decreased from 0.589 to 0.574 Pa and then increased from 0.574 to 0.588 Pa and the flow resistance first increased from 0.395 × 10¹² to 0.386 × 10¹² Pa·s·m−3 and then increased from 0.386 × 10¹² to 0.396 × 10¹² Pa·s·m−3, which first decreased by 2.5% and then increased by 2.7%. When the number of holes increased from 2 to 6, the flow rate (q) was stable at 1.49 × 10⁻¹² m3/s, the total pressure drop (Δp) increased from 0.552 to 0.748 Pa and the flow resistance increased from 0.371 × 10¹² to 0.503 × 10¹² Pa·s·m−3, which increased by 35.4%.
3.3.3. Influence of the Pit Structure on the Flow Resistance
It can be seen from Figure 9 that the flow resistance and the pressure drop (Δp) had a near linear relationship with the length of the pit canal, the pit vertical diameter, the pit spacing, and the pit domain length; the determination coefficients (R2) were 0.990 (0.996), 0.923 (0.923), 0.996 (0.994), and 0.877 (0.877), respectively, indicating that the equations were fitted well. The flow resistance increased with the increase in length of pit canal and pit spacing and decreased with the increase in pit vertical diameter and pit domain length. The parameters of the other structures of the vessel remained unchanged. When the length of the pit canal was increased from 1 to 9 μm, the flow rate (q) decreased from 1.80 × 10⁻¹² to 1.20 × 10⁻¹² m3/s, the total pressure drop (Δp) increased from 0.445 to 0.708 Pa and the flow resistance increased from 0.247 × 10¹² to 0.590 × 10¹² Pa·s·m−3, increased by 138.9%. When the pit vertical diameter was increased from 4 to 12 μm, the flow rate (q) was stable at 1.49 × 10⁻¹² m3/s, the total pressure drop (Δp) decreased from 0.839 to 0.479 Pa and the flow resistance decreased from 0.564 × 10¹² to 0.322 × 10¹² Pa·s·m−3, which decreased by 42.9%. When the pit spacing was increased from 1 to 5 μm, the flow rate (q) was stable at 1.49 × 10⁻¹² m3/s, the total pressure drop (Δp) increased from 0.533 to 0.608 Pa and the flow resistance increased from 0.359 × 10¹² to 0.409 × 10¹² Pa·s·m−3, which increased by 14.1%. When the pit domain length was increased from 100 to 300 μm, the flow rate (q) was stable at 1.49 × 10⁻¹² m3/s, the total pressure drop (Δp) decreased from 0.657 to 0.547 Pa and the flow resistance decreased from 0.442 × 10¹² to 0.368 × 10¹² Pa·s·m−3, which decreased by 16.7%.
3.4. Radial Transmission Efficiency of Magnolia Vessels
In order to analyze the influence of radial water transport caused by the pit domain on the total flow resistance, the radial transmission efficiency was defined as the percentage of radial transport resistance to the total flow resistance, expressed as:
where R is the radial transmission efficiency, T2 is the total flow resistance for only the axial water transport, and T1 is the flow resistance of the axial and radial water transport.
R = (T2 − T1)/T1,
The radial transmission efficiency of the Magnolia vessel can be obtained by Equation (3), and the corresponding T1 and T2 values of different pit domain lengths are shown in Table 3. The results showed that the pit domain length increased from 100 to 300 μm and the radial transmission efficiency increased from 43.99% to 53.21%. With the increase in the pit domain length, the number of pits increased and the radial transmission efficiency increased. The increase in radial transmission efficiency reduced the flow in the vessel and reduced the axial transport capacity.
4. Discussion
4.1. Influence of Helical Thickening on Flow Resistance Characteristics
The hydraulic conductivity of the xylem is greatly variable among different species, and it plays an important role in supporting plant growth and photosynthesis [22]. Measurements of xylem hydraulic properties provide basic information on plant water supply capacity [23], but fail to provide the effect of individual structures in xylem vessels on the flow resistance. The established mathematical models analyzed the influence of the helical thickening structure on the flow resistance of the vessel, and it was concluded that structural parameters such as the helical height, the helical width, and the helical spacing were the main factors affecting the flow resistance.
An increase in helical thickening reduced the total number of thickening regions and the pressure loss caused by the thickening region decreased, so the pressure drop and the flow resistance decreased accordingly. An increase in the helical width increased the local resistance of the thickening region, causing the pressure drop and the flow resistance to increase. An increase in the helical height reduced the radial cross-sectional area of the vessel, which caused the pressure drop and the flow resistance to increase [16]. Of these parameters, the helical height had the greatest influence on the flow resistance. This is because the helical height made the equivalent inner diameter of the vessel smaller and the flow resistance changed greatly [9].
4.2. Influence of the Scalariform Perforation Plate on Flow Resistance Characteristics
In many lineages [24], scalariform perforation plate evolved into simple perforation plate with a single circular opening. The scalariform perforation plate has a higher flow resistance than the single perforation plate in the measurement [10,25]. Structural parameters such as the thickness, the inclination angle, and the number of holes are the main factors affecting the flow resistance of the scalariform perforation plate structure. Ellerby and Ennos [25] concluded that the greater the inclination angle between the scalariform perforation plate and the axis of the vessel, the greater the flow resistance of the vessel. In this paper, it was found that when the inclination angle increased the flow resistance coefficient first decreased and then increased. The reason for this is that when the angle of the scalariform perforation plate gradually increased the structural area of the perforation plate decreased and the flow resistance decreased. When the inclination angle continued to increase, the scalariform perforation plate reduced the radial cross-section of the vessel and the flow resistance increased [26].
Among the three structural parameters, the number of holes in the perforation plate had the greatest influence on the flow resistance. With the increase in the number of holes, the area of the scalariform perforation plate passing through water decreased, and the pressure loss caused by the scalariform perforation plate increased, which in turn caused the pressure drop and the flow resistance to increase [27]. The number of holes in the scalariform perforation plate affected the radial cross-sectional area of the vessel, resulting in a large change in the fluid velocity of the vessel and a significant change in the total flow resistance. Chen and Olson [28,29] also found similar conclusions in their experiment.
4.3. Influence of the Pit Structure on Flow Resistance Characteristics
The pit structure in plant is of great significance, because the pit membrane acts as a valve to prevent the spread of embolism [7]. As suggested from many experimental and theoretical perspectives [30,31], pit structure influences the hydraulic efficiency of the xylem. We assumed no pit membrane in the pit structure of Magnolia xylem, and structural parameters such as the length of the pit canal, the pit vertical diameter, the pit spacing, and the pit domain length were the main factors affecting the flow resistance of the pit structure. An increase in the pit vertical diameter and the pit domain length led to the pit area increasing, which increased radial water transport through the vessel and reduced the flow resistance. An increase in the pit spacing reduced the pit area, which decreased radial water transport through the vessel and increased the flow resistance. A decrease in the length of the pit canal led to a decrease in the flow resistance of the pit structure, which was beneficial to the water transport [30,32]. The pit structure without a membrane was the main factor causing the decrease in the pressure drop in the vessel. The reason for this is that the pit structure caused the vessel to produce radial water transport and the pressure drops. Xu et al. [15] found that the radial transmission efficiency of Jatropha curcas xylem was between 0% and 5.09%. In this paper, the radial transmission efficiency of Magnolia was between 43.99% and 53.21%. The main reason for the difference between the studies is that there was a pit membrane in the pit structure of Jatropha curcas, which reduced the radial transmission capacity, whereas there was no pit membrane in our model of Magnolia, which increased the radial transmission efficiency. Our model of the cell wall pits was simplified, not accounting for the variations in the structure of intervessel pits, vessel-to-ray pits, and vessel-to-fiber pits. Further studies should aim to improve our understanding of the xylem vessel pit structure in Magnolia and its influence on the xylem water transport.
5. Conclusions
- (1)
- The study showed that the xylem vessels of Magnolia had a helical thickening structure and a pit structure of a secondary wall, and the end walls had a scalariform perforation plate. The helical thickening and scalariform perforation plate increased the flow resistance of the vessel, and the pit structure reduced the flow resistance of the vessel.
- (2)
- The flow resistance increased with the increase in the helical width and the helical height and decreased with an increase in the helical spacing, and the helical height had the greatest influence on the flow resistance. The flow resistance increased with the increase in the thickness of the scalariform perforation plate and the number of holes in the scalariform perforation plate. It decreased first and then increased with the increase in the inclination angle of the scalariform perforation plate. The number of holes in the scalariform perforation plate had the greatest influence on the flow resistance. The flow resistance increased with the increasing length of the pit canal and the pit spacing and decreased with the increasing pit vertical diameter and pit domain length, and the length of pit canal had the greatest influence on the flow resistance.
- (3)
- The radial transmission efficiency of the vessel was positively correlated with the pit domain length. In the case of no pit membrane in the pit structure, the radial transmission efficiency was between 43.99% and 53.21%. No pit membranes were included in the model, which likely has resulted in an overestimation of the actual “radial transmission efficiency”.
Author Contributions
E.Z. has contributed most to the conception, guidance, and revision of the manuscript. The software analysis was performed by Y.S., S.Z. and Z.L. The manuscript was written by T.X. All authors have read and agreed to the published version of the manuscript.
Funding
This work was supported by the Basic Scientific Research Fund of Heilongjiang Provincial Universities (2021-KYYWF-0050).
Institutional Review Board Statement
Not applicable.
Informed Consent Statement
Not applicable.
Data Availability Statement
The data that support the finding of this study are available from the corresponding author upon reasonable request.
Acknowledgments
The authors acknowledge the co-operation and support of School of Hydraulic and Electric Power, Heilongjiang University, Harbin 150080, China for this research.
Conflicts of Interest
The authors declare no conflict of interest.
References
- Kang, S. Study on the distribution law of water flow resistance in soil-plant-atmosphere continuum. J. Ecol. 1993, 2, 61–67, (In Chinese with English Abstract). [Google Scholar]
- Kang, S. Dynamics of water transport in soil-plant-atmosphere continuum and its application. Mech. Pract. 1993, 15, 11–19, (In Chinese with English Abstract). [Google Scholar] [CrossRef]
- Xian-Chong, W.; Ping, M. Physiological and ecological mechanisms of long-distance water transport in plants: A review of recent issues. Chin. J. Plant Ecol. 2007, 31, 804–813. [Google Scholar] [CrossRef] [Green Version]
- Xu, L.; Xu, J.; Dong, L. Research advance in process and modeling of water transfer in soil-plant-atmosphere continuum. Agric. Res. Arid Areas 2013, 31, 242–248, (In Chinese with English Abstract). [Google Scholar] [CrossRef]
- Tyree, M.T.; Zimmermann, M.H. Xylem Structure and the Ascent of Sap; Springer: Berlin/Heidelberg, Germany, 2002. [Google Scholar] [CrossRef]
- Bai, D.; Deng, X.; Huang, M. Water transmission and regulation in plants. Acta Bot. Boreali-Occident. Sin. 2003, 23, 1637–1643. [Google Scholar] [CrossRef]
- Schulte, P.J.; Hacke, U.; Schoonmaker, A.L. Pit membrane structure is highly variable and accounts for a major resistance to water flow through tracheid pits in stems and roots of two boreal conifer species. New Phytol. 2015, 208, 102–113. [Google Scholar] [CrossRef]
- Bouche, P.S.; Larter, M.; Domec, J.-C.; Burlett, R.; Gasson, P.; Jansen, S.; Delzon, S. A broad survey of hydraulic and mechanical safety in the xylem of conifers. J. Exp. Bot. 2014, 65, 4419–4431. [Google Scholar] [CrossRef] [Green Version]
- Jacobsen, A.L.; Ewers, F.W.; Pratt, R.B.; Paddock, W.A.; Davis, S.D. Do Xylem Fibers Affect Vessel Cavitation Resistance? Plant Physiol. 2005, 139, 546–556. [Google Scholar] [CrossRef] [Green Version]
- Christman, M.A.; Sperry, J.S. Single-vessel flow measurements indicate scalariform perforation plates confer higher flow resistance than previously estimated. Plant Cell Environ. 2010, 33, 431–443. [Google Scholar] [CrossRef]
- Jansen, S.; Choat, B.; Pletsers, A. Morphological variation of intervessel pit membranes and implications to xylem function in angiosperms. Am. J. Bot. 2009, 96, 409–419. [Google Scholar] [CrossRef]
- Tixier, A.; Herbette, S.; Jansen, S.; Capron, M.; Tordjeman, P.; Cochard, H.; Badel, E. Modelling the mechanical behaviour of pit membranes in bordered pits with respect to cavitation resistance in angiosperms. Ann. Bot. 2014, 114, 325–334. [Google Scholar] [CrossRef] [PubMed] [Green Version]
- Zwieniecki, M.A.; Melcher, P.J.; Holbrook, N.M. Hydraulic properties of individual xylem vessels of Fraxinus americana. J. Exp. Bot. 2001, 52, 257–264. [Google Scholar] [CrossRef] [PubMed] [Green Version]
- Schulte, P.J. Water flow through a 20-pore perforation plate in vessels of Liquidambar styraciflua. J. Exp. Bot. 1999, 50, 1179–1187. [Google Scholar] [CrossRef]
- Xu, T.; Zhang, L.; Li, Z. Computational fluid dynamics model and flow resistance characteristics of Jatropha curcas L. xylem vessel. Sci. Rep. 2020, 10, 14728. [Google Scholar] [CrossRef]
- Chen, Q.; Xu, F.; Ai, Q.; Zhang, L. Hydrodynamic model and flow resistance characteristics of plant vessel wall thickenings. Trans. Chin. Soc. Agric. Eng. 2015, 31, 1–8. [Google Scholar] [CrossRef]
- Yao, Z.-X.; Yang, J.-F.; Liu, Y.; Dong, S.-S.; Wu, H.; Zhang, S.-Z. The complete chloroplast genome of Magnolia sinostellata (Magnoliaceae), a rare and endangered species of China. Mitochondrial DNA Part B 2018, 3, 742–743. [Google Scholar] [CrossRef] [PubMed] [Green Version]
- Gao, Y.; Yang, Z.; Wang, G.; Sun, J.; Zhang, X. Discerning the Difference Between Lumens and Scalariform Perforation Plates in Impeding Water Flow in Single Xylem Vessels and Vessel Networks in Cotton. Front. Plant Sci. 2020, 11, 246. [Google Scholar] [CrossRef]
- Wang, F. Computational Fluid Dynamics Analysis; Tsinghua University Press: Beijing, China, 2004; (In Chinese with English Abstract). [Google Scholar]
- Roth, A. Water transport in xylem conduits with ring thickenings. Plant Cell Environ. 1996, 19, 622–629. [Google Scholar] [CrossRef]
- Bierhorst, D.W.; Zamora, P.M. Primary xylem elements and element associations of angiosperms. Am. J. Bot. 1965, 52, 657–710. [Google Scholar] [CrossRef]
- Brodribb, T.J. Xylem hydraulic physiology: The functional backbone of terrestrial plant productivity. Plant Sci. 2009, 177, 245–251. [Google Scholar] [CrossRef]
- Melcher, P.J.; Holbrook, N.M.; Burns, M.J.; Zwieniecki, M.A.; Cobb, A.R.; Brodribb, T.J.; Choat, B.; Sack, L. Measurements of stem xylem hydraulic conductivity in the laboratory and field. Methods Ecol. Evol. 2012, 3, 685–694. [Google Scholar] [CrossRef]
- Carlquist, S. Pit membrane remnants in perforation plates of primitive dicotyledons and their significance. Am. J. Bot. 1992, 79, 660–672. [Google Scholar] [CrossRef]
- Ellerby, D.J.; Ennos, A.R. Resistances to fluid flow of model xylem vessels with simple and scalariform perforation plates. J. Exp. Bot. 1998, 49, 979–985. [Google Scholar] [CrossRef]
- Ai, Q.; Xu, F.; Chen, Q.; Chen, J.; Wang, P. Flow resistance characteristics of scalariform perforation plates in plant xylem vessels. Trans. Chin. Soc. Agric. Mach. 2011, 42, 143–148. [Google Scholar]
- Kim, H.K.; Lee, S.J. Synchrotron X-ray imaging for nondestructive monitoring of sap flow dynamics through xylem vessel elements in rice leaves. New Phytol. 2010, 188, 1085–1098. [Google Scholar] [CrossRef]
- Chen, Q. Hydrodynamics Modeling and Flow Resistance Characteristics of Tissue Structure of Plant Vessel and Trachied; Zhejiang University of Technology: Hangzhou, China, 2016; (In Chinese with English Abstract). [Google Scholar]
- Olson, M.; Rosell, J.A.; Martínez-Pérez, C.; León-Gómez, C.; Fajardo, A.; Isnard, S.; Cervantes-Alcayde, M.A.; Echeverría, A.; Figueroa-Abundiz, V.A.; Segovia-Rivas, A.; et al. Xylem vessel-diameter–shoot-length scaling: Ecological significance of porosity types and other traits. Ecol. Monogr. 2020, 90, e01410. [Google Scholar] [CrossRef]
- Schulte, P.J. Computational fluid dynamics models of conifer bordered pits show how pit structure affects flow. New Phytol. 2012, 193, 721–729. [Google Scholar] [CrossRef] [PubMed]
- Gleason, S.M.; Westoby, M.; Jansen, S.; Choat, B.; Hacke, U.; Pratt, R.B.; Bhaskar, R.; Brodribb, T.; Bucci, S.J.; Cao, K.-F.; et al. Weak tradeoff between xylem safety and xylem-specific hydraulic efficiency across the world’s woody plant species. New Phytol. 2016, 209, 123–136. [Google Scholar] [CrossRef] [Green Version]
- Chen, Q.; Xu, F.; Ai, Q.; Zhang, L. Hydrodynamics Modeling and Flow Resistance Characteristics Simulation of Plant Tracheid Pit. Trans. CSAM 2016, 47, 303–310. [Google Scholar] [CrossRef]
Figure 1.
Schematic diagram of Magnolia samples.

Figure 2.
Original SEM images of the cross-sectional and axial sectional structures of Magnolia: (a) microscopic images of a cross-section of the vessel sample; (b) microscopic images of an axial section of the vessel sample.
Figure 2.
Original SEM images of the cross-sectional and axial sectional structures of Magnolia: (a) microscopic images of a cross-section of the vessel sample; (b) microscopic images of an axial section of the vessel sample.

Figure 3.
Schematic diagram of the vessel structure and model: (a) vessel structure; (b) fluid-domain model of the vessel.
Figure 3.
Schematic diagram of the vessel structure and model: (a) vessel structure; (b) fluid-domain model of the vessel.

Figure 4.
Local grid distribution in the fluid domain.

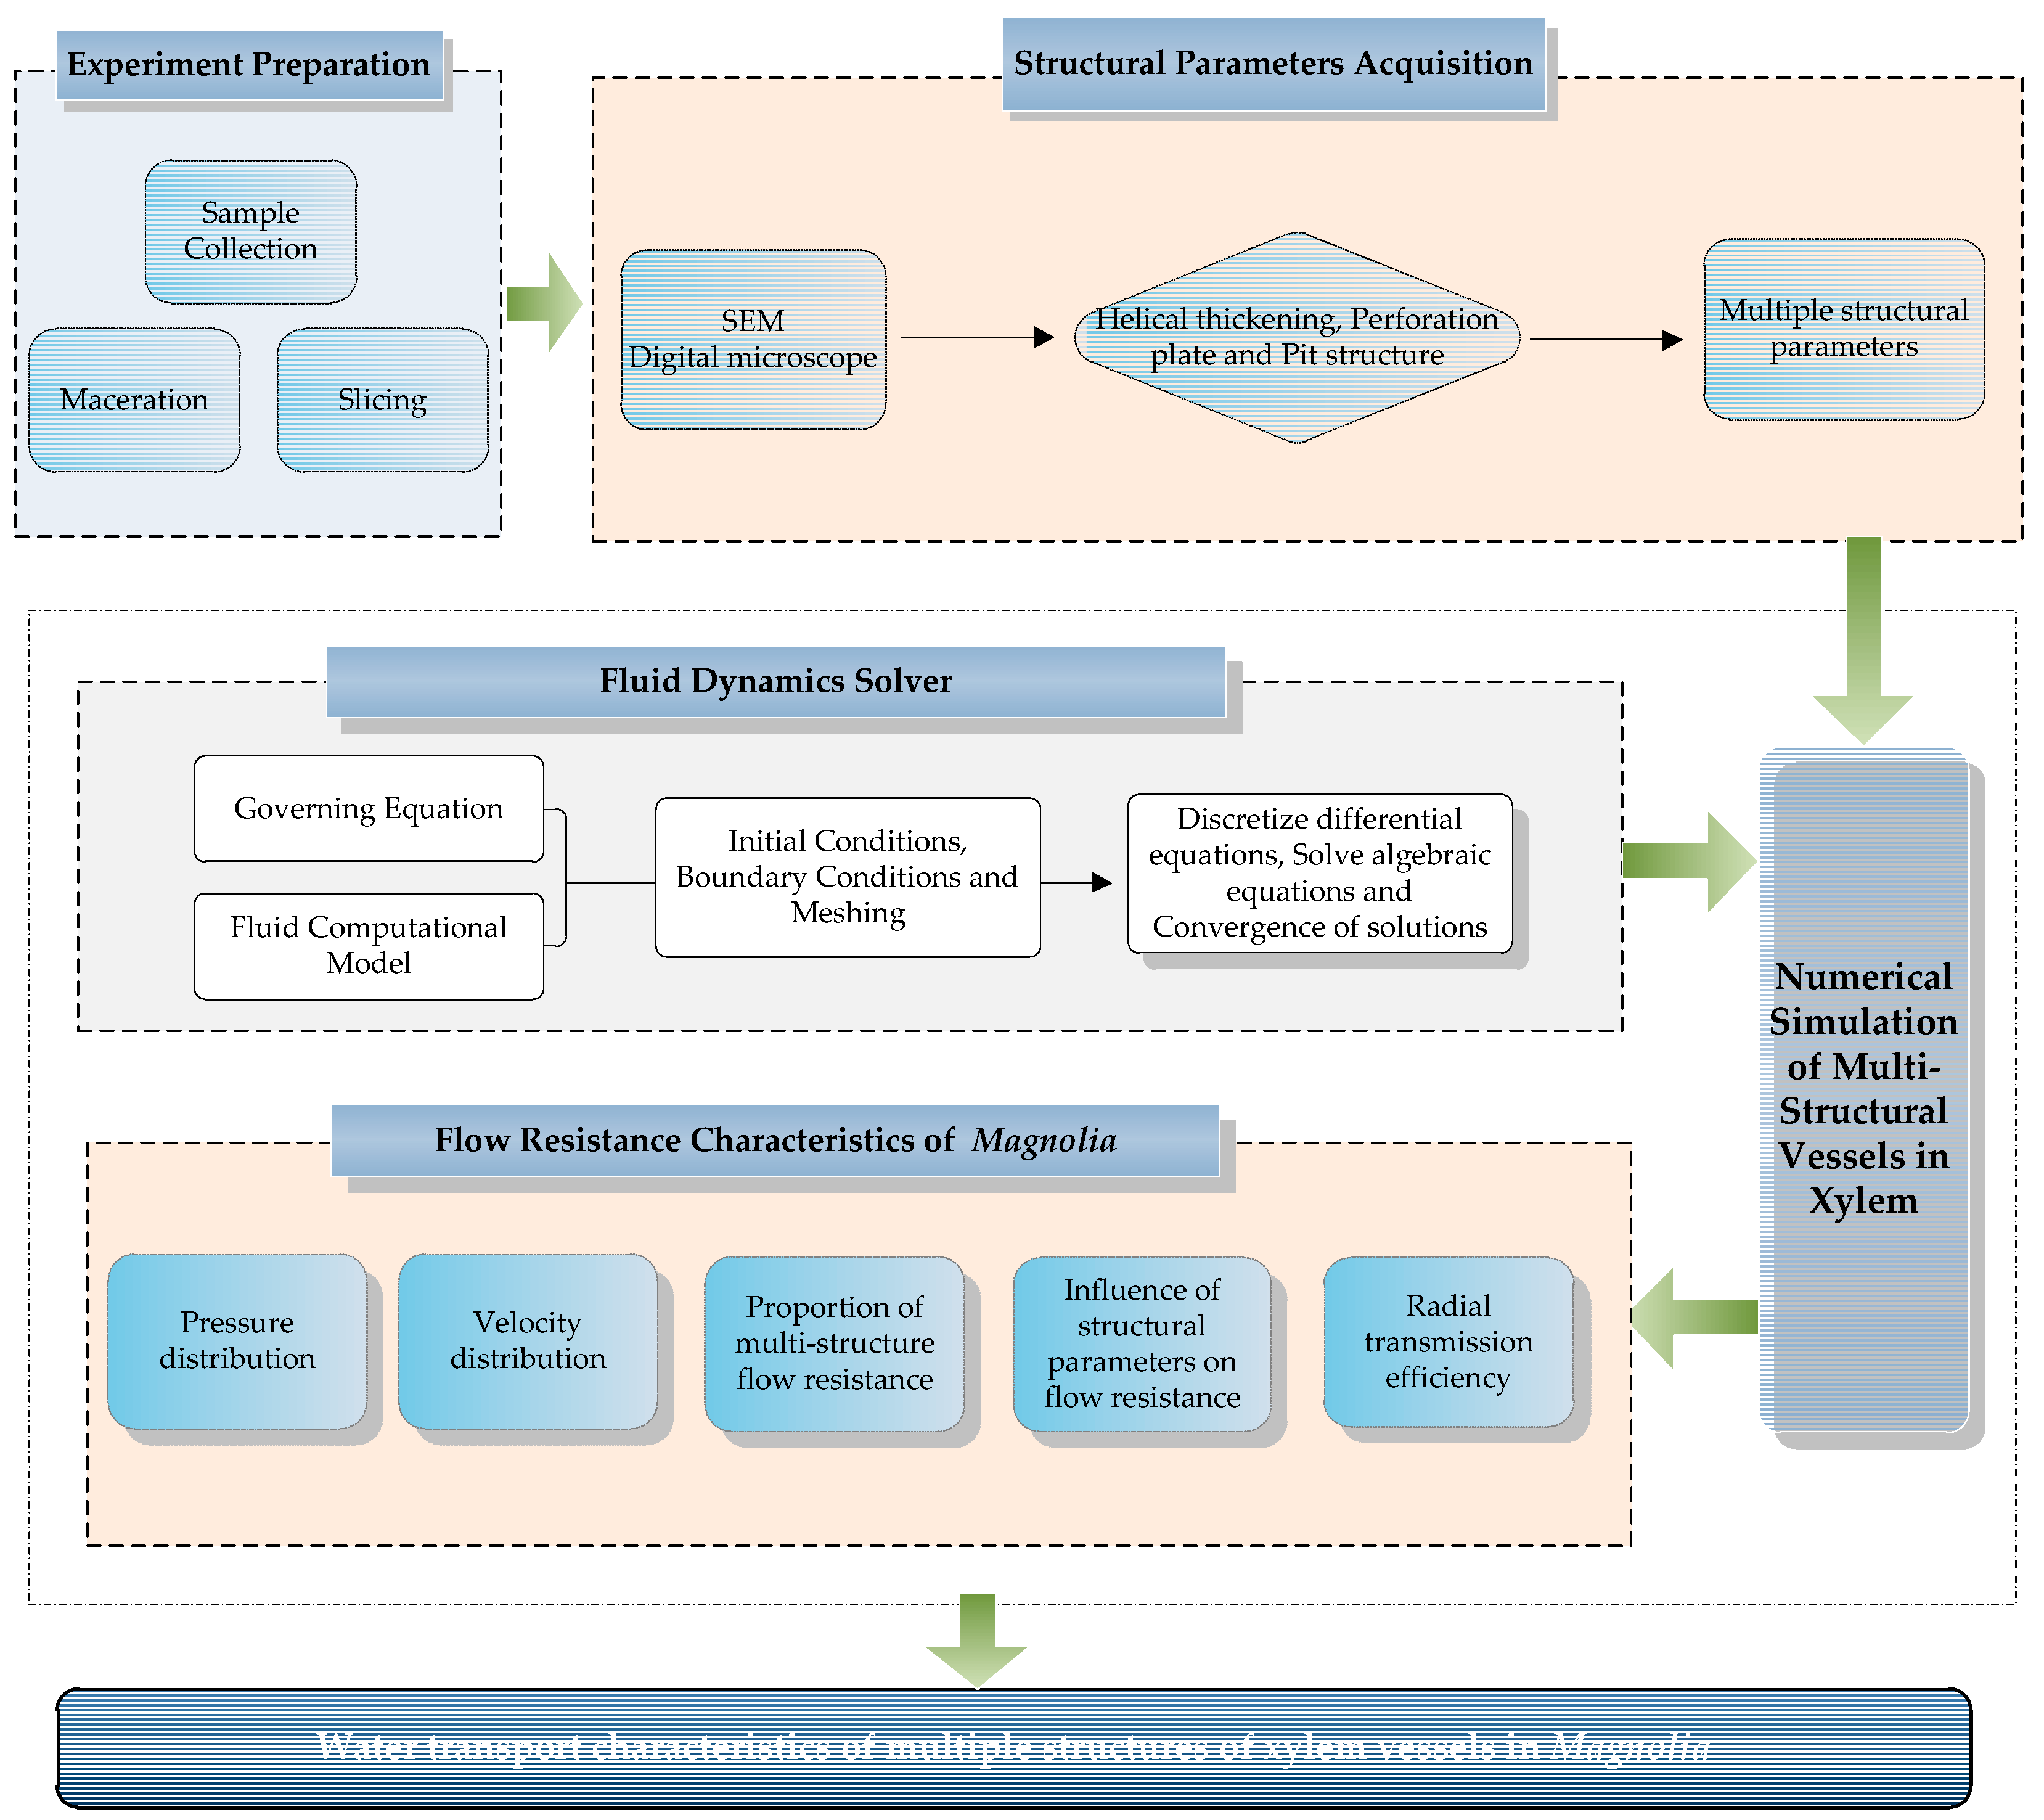
Figure 5.
Flow chart of the flow resistance characteristics of xylem vessels.

Figure 6.
Velocity and pressure distributions inside the xylem vessel: (a) velocity distribution of the vessel; (b) pressure distribution of the vessel.
Figure 6.
Velocity and pressure distributions inside the xylem vessel: (a) velocity distribution of the vessel; (b) pressure distribution of the vessel.

Figure 7.
Flow resistance trends of the helical thickening structure.

Figure 8.
Flow resistance trends of the scalariform perforation plate structure.

Figure 9.
Flow resistance trends of the pit structure.


Table 1.
Geometry parameters of Magnolia.
| Vessel and Perforation Plate | Pit Structure | Helical Thickening | |||
|---|---|---|---|---|---|
| Parameters | Type/Value | Parameters | Type/Value | Parameters | Type/Value |
| Vessel structure | Helical + pit + perforation plate | Pit type | Simple pit | Type of secondary thickening | Helical thickening |
| Vessel length | 500 μm ± 200 μm | Pit membrane structure | No Pit membrane | Section shape of helical | Circular arc type |
| Inner diameter | 80 ± 3 μm | Pit domain length | 200 μm ± 100 μm | Helical spacing | 3 ± 0.5 μm |
| Wall thickness | 5 ± 0.5 μm | Pit horizontal diameter | 45 ± 2 μm | Helical width | 1 ± 0.1 μm |
| Type of the perforation plate | Scalariform | Pit vertical diameter | 8 ± 2 μm | Helical height | 1.6 ± 0.2 μm |
| Inclination angle of the perforation plate | 60° ± 2° | Length of the pit canal | 5 ± 0.5 μm | Inclination angle of helical | 90° ± 1° |
| Thickness of the perforation plate | 5 ± 0.2 μm | Pit spacing | 3 ± 0.5 μm | ||
Note: Plus and minus signs are standard errors.
Table 2.
Influence of the vessel structure on flow resistance.
| Computational Model | Pressure Drop ΔP (Pa) | Average Flow Q (10−12 m3·s−1) | Flow Resistance (×1012 Pa·s·m−3) |
|---|---|---|---|
| Smooth vessel | 0.926 | 1.49 | 0.620 |
| Smooth vessel + helical thickening | 1.006 | 1.49 | 0.683 |
| Smooth vessel + helical thickening + scalariform perforation plate | 1.740 | 1.49 | 1.171 |
| Smooth vessel + helical thickening + scalariform perforation plate + pit structure | 0.574 | 1.49 | 0.528 |
Table 3.
Influence of the pit domain length on the radial transmission efficiency.
| Pit Domain Length | T1 (×1012 Pa·s·m−3) | T2 (×1012 Pa·s·m−3) | R |
|---|---|---|---|
| 100 μm | 0.442 | 0.789 | 43.99% |
| 150 μm | 0.401 | 0.788 | 49.15% |
| 200 μm | 0.386 | 0.787 | 50.98% |
| 250 μm | 0.374 | 0.787 | 52.48% |
| 300 μm | 0.368 | 0.786 | 53.21% |
Publisher’s Note: MDPI stays neutral with regard to jurisdictional claims in published maps and institutional affiliations. |
© 2022 by the authors. Licensee MDPI, Basel, Switzerland. This article is an open access article distributed under the terms and conditions of the Creative Commons Attribution (CC BY) license (https://creativecommons.org/licenses/by/4.0/).
Share and Cite
MDPI and ACS Style
Xu, T.; Zhi, S.; Su, Y.; Li, Z.; Zheng, E. Water Transport Characteristics of Multiple Structures of Xylem Vessels in Magnolia. Forests 2022, 13, 1617. https://doi.org/10.3390/f13101617
AMA Style
Xu T, Zhi S, Su Y, Li Z, Zheng E. Water Transport Characteristics of Multiple Structures of Xylem Vessels in Magnolia. Forests. 2022; 13(10):1617. https://doi.org/10.3390/f13101617
Chicago/Turabian StyleXu, Tianyu, Shuteng Zhi, Yanru Su, Zonglei Li, and Ennan Zheng. 2022. "Water Transport Characteristics of Multiple Structures of Xylem Vessels in Magnolia" Forests 13, no. 10: 1617. https://doi.org/10.3390/f13101617
Note that from the first issue of 2016, this journal uses article numbers instead of page numbers. See further details here.