Article

Long-Term Strength Evolution in Ambient-Cured Solid-Activator Geopolymer Compositions

1
School of Materials Science and Engineering, UNSW Sydney, Kensington, Sydney 2052, Australia
2
Brickworks Ltd., Horsley Park, Sydney 2175, Australia
3
Nuclear Magnetic Resonance Facility, Mark Wainwright Analytical Centre, UNSW Sydney, Kensington, Sydney 2052, Australia
*
Author to whom correspondence should be addressed.
Minerals 2021, 11(2), 143; https://doi.org/10.3390/min11020143
Submission received: 15 December 2020 / Revised: 23 January 2021 / Accepted: 25 January 2021 / Published: 30 January 2021

Abstract

:
The major downsides of cement manufacturing are the high CO2 emissions and high energy usage. Geopolymers, which are fabricated by activation of blends of fly ash (FA) and ground granulated blast furnace slag (GGBFS) using an alkaline activator, offer a promising solution to this issue. However, to enhance the replacement of cement in construction applications, geopolymer compositions have to be designed such that they can be activated on site by just adding water, similar to how cements are used. Therefore, the present work uses solid sodium metasilicate (MS, Na2SiO3) as the alkaline activator in order to design an add-water-style FA/GGBFS-based geopolymer composition. These compositions were designed by optimising the binder (FA/GGBFS) ratio, Na2SiO3/binder ratio, and water/binder ratio individually to assess the effects of these parameters on the setting times and mechanical (flexural and compressive) strengths over extended curing times (three months). The major factors affecting the strength development and setting times (initial and final) were the amounts of GGBFS and Na2SiO3, with the former demonstrating the more dominant effect. The consistent strength development with curing time was attributed to calcium aluminium silicate hydrate (CASH) gel formation in the early curing times which was affected by the slag addition levels, and sodium aluminium silicate hydrate (NASH) gel formation at later curing times which was influenced by the metasilicate addition levels. The metasilicate amounts were observed to impact on CASH gel formation in early stage curing. Geopolymer compositions with FA/GGBFS ratio of 35/65 and MS/water ratios of 0.2 showed high compressive strengths of ~70 MPa at 28 days, which are superior to values seen in conventional ordinary Portland cement (OPC) mixes for the same curing times.

1. Introduction

Concrete is the most widely used building material in the world, owing to its low cost and ease of availability of raw materials. However, a major downside of concrete manufacturing is the huge carbon footprint from ordinary Portland cement (OPC) production process, which contributes to ~5% of the global CO2 emissions [1,2]. Geopolymer cements (GPC) are a recent innovation in the concrete industry, whereby the cement component is partially or entirely replaced with pozzolanic materials [3,4]. Geopolymers commonly represent the crystalline products of the reactions of aluminosilicate pozzolanic raw materials with alkaline hydroxide and/or alkaline silicate solutions. The typical raw materials used to fabricate geopolymers are fly ash (FA) and ground granulated blast furnace slag (GGBFS) and the resultant blends are activated by an alkali solution resulting in the formation of a binder gel. Both fly ash and slag are by-products of industrial processes; fly ash is obtained from the electrostatic precipitators in coal combustion power plants while slag is the by-product of iron production in blast furnaces [4]. Thus, geopolymers provide a functional use for these waste materials that would otherwise occupy the limited storage available at industrial sites or in landfill.
The alkali activator used is either a hydroxide or a silicate of sodium (Na) or potassium (K), while mixtures of hydroxides and silicates are also used. Geopolymers provide technical advantages over traditional cement materials such as superior mechanical properties and good chemical resistance. However, the uptake of geopolymers is not widely implemented due to a number of issues including insufficient studies into the various compositional properties and the absence of standards for either regulatory testing or industrial applications [4,5,6]. Moreover, most of the studies on geopolymers have been at a laboratory scale and/or with heat curing [5]. However, recent studies have demonstrated that geopolymers can be fabricated in ambient temperature curing conditions while using activators with lower alkalinity [7,8,9,10]. By adopting this strategy, geopolymer manufacturing can be made less hazardous by reducing the corrosive nature of the activator and lowering the energy costs associated with the process since heat curing is not used. However, significant variations in chemical composition and particle sizes can exist between geopolymer sources and this requires further investment in optimisation of formulation and development of certification standards.
FA is a pozzolanic glassy material, which chemically consists predominantly of silica-rich glass and quartz (SiO2) and mullite (3Al2O3-2SiO2) and minor to trace amounts of hematite (Fe2O3) and magnetite (Fe3O4) [4]. FA is classified into two categories: Class F and Class C based on the calcium oxide (CaO) content. Class F FA is typically low in CaO (<15%) and contains higher amounts of SiO2, Al2O3, and Fe2O3 (>70%), whereas Class C FA contains higher percentage of CaO (typically 15–30%) [3]. GGBFS is produced as a vitreous by-product of iron production and predominantly consists of CaO, SiO2, and Al2O3 in a mixture of depolymerised calcium-silicate glasses and minor polycrystalline phases [4,11].
Due to the effect of calcium hydroxide (Ca(OH)2) in cement in promoting the pozzolanic effect of FA, the latter is used as a supplementary cementitious material [2,10]. However, when FA is used as a complete substitute for OPC, it significantly retards the reaction rate owing to the decrease in Ca content [7,10]. Owing to this, it is necessary to use an alkaline activator to promote the geopolymerisation of FA [12]. Along the same line, since GGBFS has a high content of CaO, it speeds up the reaction rate to such an extent that it creates a risk of flash setting if used alone [13]. Therefore, FA and GGBFS are usually used in tandem to maximise their advantages and reduce their disadvantages with regard to the setting rate [10]. The dissolution of GGBFS results in a calcium-silicate-hydrate (CSH) gel due to its high CaO content, whereas FA forms a M-aluminosilicate-hydrate (M-ASH) gel, with the balancing metal (M) cation arising from the alkali-activator.
Sodium hydroxide (NaOH) and sodium silicate [(Na2O)x (SiO2)y] are commonly used as alkali-activators in geopolymer fabrication. NaOH forms a strong matrix through strong pairing of small silicate oligomers [2]. However, the ions from the hydroxide continually break apart the structure of the cross-linked aluminosilicate chains within the gels resulting in a lowering of compressive strength [14,15]. However, when (Na2O)x•(SiO2)y is used as the sole activator, it has been shown to improve the geopolymerisation rate by accelerating the dissolution of the source material, in this case FA or GGBFS, thus resulting in a greater extent of increase in the mechanical strength compared to compositions activated using only NaOH [16]. These components are all crucial for geopolymerisation to occur and this process occurs via four stages, namely dissolution, restructuring, gelation, and reorganisation [17,18,19,20,21] and these are illustrated in Figure 1. As dissolution occurs in water, the Si-O/Al-O bonds in the solid silica-/alumina-rich binder material are ruptured by the hydroxyl initiator [OH] by hydrolysis, thereby producing tetrahedral silicate and aluminate species, [Si(OH)4]4– and [Al(OH)4]. At high pH, due to the presence of the activator, a supersaturated aluminosilicate solution is created owing to the increased dissolution rate of amorphous aluminosilicates. The alkali activator causes these dissolved species to restructure themselves in more thermodynamically favourable positions before undergoing polycondensation, which results in the formation of a large network [Mz(AlO2)x(SiO2)ynMOH·mH2O] gel. During gelation, water condenses out of the system resulting in an overall shrinkage in the macroscopic structure. As the connectivity of the network increases after gelation, the system continues to rearrange and reorganise forming a three-dimensional aluminosilicate network.
Of particular interest is the utilisation and development of solid alkaline activators, which can be used instead of conventional activators, which are either liquids or aqueous solutions. The advantage of solid activators is a reduction in the risks of storing and manual handling of the liquid activators since the fomer becomes active only when water is added to it, thereby improving its applicability for on-site use. Table 1 summarises prior work on solid-activated geopolymer compositions and their compressive strengths determined at different curing times.
These results show that geopolymers can be successfully produced using only solid activators under ambient conditions resulting in good compressive strengths. However, the comparison of the results in these studies is not linear owing to differences owing to the variations in parameters used in terms of aggregates, curing conditions, sample preparation, and compression test parameters. Furthermore, as seen from the table, there has been no systematic evaluation of the effect of FA/slag ratio, solid activator amounts, and water contents on the strength development of solid-activator geopolymer compositions. The studies listed mostly used either pure FA or pure GGBFS compositions, while those containing mixtures only used a constant sodium metasilicate [(Na2O)x•(SiO2)] activator concentration.
Therefore, the present study is the first to conduct a comprehensive investigation into the three key factors, namely the binder (FA/GGBFS) ratio, Na2SiO3/binder ratio, and water/binder ratio on the strength development of FA/GGBFS geopolymers activated using solid activator sodium metasilicate [Ms (silicate modulus (SiO2/Na2O)) of 1].

2. Experimental

2.1. Materials

Fly ash (Class F) was sourced from Eraring power plant (NSW). Ground granulated blast furnace slag was provided by Ecocem (Warrawong, NSW, Australia), a subsidiary of Australian Steel Mill Services (ASMS). Sodium metasilicate pentahydrate (Na2SiO3) pellets with a silicate modulus of 1 was sourced from Jasol’s distributor, COS (Lidcombe, NSW, Australia). Sodium hydroxide micro pearls (99.4% purity) were sourced from Redox Pty Ltd. (Minto, NSW, Australia). The sand was supplied by Brickworks Pty. Ltd. (Wetherill Park, NSW, Australia). General purpose ordinary Portland cement was sourced from Australian Builders. Table 2 and Table 3 show the elemental oxide composition of FA and GGBFS determined by X-ray fluorescence (XRF) and Table 4 shows the particle size distribution of these raw materials measured using laser diffraction (Malvern Mastersizer).

2.2. Mix Design

The geopolymer pastes, mortar and concretes, were fabricated by varying the binder ratio (FA/GGBFS), MS content, NaOH molarity, and curing time. The effect of altering these parameters on the compressive strength, flexural strength, and resultant microstructures was determined at different curing times of 7 to 91 days.

2.2.1. Sample Nomenclature

The sample nomenclature convention follows this order for all samples in both two series A and B:
FA/BFS ratio (wt%)/MS to binder ratio [−water (g)]
The water content is only included in the label for series A where the effect of water content on strength was examined. Otherwise, they all follow the nomenclature shown above. For example, the composition 40/60/0.2 contains 250 g of the binder with 40 wt% FA and 60 wt% GGBFS, with a MS to binder ratio of 0.2 wt% (50 g). In series A, if the water content is 100 g, then it is not shown in the sample name. Additional water was mixed in with the sand to achieve the desired consistency.

2.2.2. Preparation of Geopolymer Mortar Samples

Geopolymer mortar samples were fabricated to study the compressive and flexural strength development over increasing time intervals of 7, 14, 28, 56, and 91 days. Series A was only tested for compressive strength and was cast into cubes of 25 × 25 × 25 mm3 dimensions. Series B was tested for both compressive and flexural strength, and both the compression and flexural samples were cast from the same bar of dimensions 25 × 25 × 120 mm3 and testing was done using the Universal Instron 5982 with a load cell of 100 kN. After flexural testing, a samples of 25 mm length from both ends were cut off to use as the compression samples. Because the mortar is brittle, it was established that there was no risk of lateral cracks reaching the end of the samples and affecting the subsequent compression test results.
To produce the mortar samples for series A and B, first a dry mix of binders + activators were measured out in proportions described in Table 5 and Table 6, then mixed together in a Kenwood Patissier electric mixer until the mix was visually homogenous. Following this, deionised water was added to the dry mix and allowed to stir for 2 min to allow time for the powder activator to dissolve. Next, 500 g of fine sand was gradually poured into the mix and was left to stir until it showed a smooth and even consistency.
The wet mortar was packed into a 4 × 4 brass mould grid with cubic cavities of 25 × 25 × 25 mm3 for series A and plastic mould with bar cavities of 25 × 25 × 120 mm3 for series B. The mould was lubricated with kerosene to allow for easy removal of samples after an initial 24 h of curing. The filled moulds were then placed on a vibrating table (Dynapac BP48) for 2 min to remove any trapped air bubbles. Next, the mould was placed in a sealable plastic bag for 24 h at ambient temperature (23 °C) for curing. Then, the samples were removed from the moulds and placed into resealable plastic containers and left to cure at ambient temperature. At selected time intervals of 7, 14, 28, and 56 days, three specimens were removed from the bag and then had their faces ground and made parallel by grinding using SiC papers of 320 and then 800 grit to ensure a smooth and flat surface for an even distribution of load during testing. Series B was later fabricated based on the preliminary exploratory findings of Series A. Additionally, a batch of OPC was made for both series A and B to act as a control. For Series A, 250 g of OPC and a total of 150 g of deionised water were mixed in the same way as the geopolymer mixes, whereas for Series B, the OPC was mixed in the same water/binder ratio of 0.504.

2.3. Testing Methods

2.3.1. Mechanical Testing

The samples were tested at curing times of 7, 14, 28, 56, and 91 days with the average value recorded for both the compressive strength and the flexural strength. The specific details and standards for the testing of the mortar samples are as follows: flexural and compression mortar samples were both tested using an Instron 5982 High-capacity Universal testing machine with a load cell of 100 kN. The specimen dimensions were measured using a Vernier calliper, and testing was performed in accordance with ASTM C348 [26] at 773 N/s loading rate for flexure whilst compression was done in accordance with ASTM C109 [27] at 1200 N/s loading rate.

2.3.2. Setting Time

Samples were subjected to a Vicat needle test, in accordance with ASTM C191 [28], to determine the effect of binder ratio and activator ratio on the setting time. Paste samples were made with the same binder and activator ratio as the mortar samples; however, a water/binder ratio of 0.427, instead of the original 0.504, was used to account for the absence of sand in the paste samples.
The initial setting time is the difference between the time at which water added to the mixture to the time at which the penetration of the needle is measured to be 25 mm in depth. A straight needle of 1 mm Ø was used. Results were measured every 5 min and the initial setting time recorded was rounded to the nearest 1 min by interpolating the time for 25 mm penetration depth in the following equation.
Initial   setting   time = [ H E C D   × ( C 25 ) ]
where:
C = penetration depth at time E [mm]
D = penetration depth at time H [mm]
E = time of last penetration greater than 25 mm [min]
H = time of first penetration less than 25 mm [min]
The final setting time is when the needle no longer leaves a complete circular impression on the paste surface. A straight needle of 1 mm Ø with a small circular attachment of 5 mm Ø was used. Results were recorded at 2 min intervals.

2.4. Sample Characterisation

The procedure to fabricate the geopolymer paste is identical to that described in Section 2.2.2, except no sand was used. The geopolymer paste was poured directly into a small plastic container once it appeared to be visually homogenous with a smooth consistency.

2.4.1. Scanning Electron Microscopy (SEM) and Energy Dispersive Spectrometry (EDS)

A Hitachi S3400 SEM with EDS capabilities was used for both topographical and compositional analyses. The sample stage was set to 5 mm working distance, 15 kV accelerating voltage, and 50 mA probe current for SEM. For EDS, the working distance was set to 10 mm. All samples were ground in a dry state using SiC papers with grits of 320, 800, and 1200 in sequence and then carbon coated prior to examination.

2.4.2. X-ray Diffraction (XRD)

A Panalytical X’Pert Multipurpose X-ray Diffractometer (MPD XRD) was used to analyse the phases in the geopolymer pastes. The samples were analysed at a voltage of 45 kV and a current of 40 mA while using CuKα radiation with a scan step size of 0.026° and wavelength of 1.54 Å. They were scanned over a range of 5° to 80° 2θ. Samples were prepared by grinding the paste using a Rocklabs ring mill which was then passed through a 200 μm sieve to ensure that particles were of a narrower size distribution.

2.4.3. Nuclear Magnetic Resonance (NMR)

NMR analysis was performed to determine the bonding states of the major species within the geopolymer paste, specifically the 23Na, 29Si, 27Al, and 1H (proton) nuclei, using a Bruker Advance III solids-300 MHz spectrometer with a 7 T superconducting magnet. The powdered samples were prepared in the same way as the XRD samples. ~120 mg of powder was placed into 4 mm zirconia rotors fitted with Kel-f caps that were spun at a 12 kHz magic angle spinning (MAS) in a double resonance H-X probehead.
The analysis was conducted at frequencies of 59.5 MHz for 29Si, 78.1 MHz for 27Al, 79.2 MHz for 23Na, and 300 MHz for 1H nuclei. 29Si and 1H were optimised at 5 µs and 3.5 µs each for their 90° radio frequency pulse lengths and 23Na and 27Al were done using 3 µs hard pulses. The 1D quantitative 29Si NMR spectra were acquired with a spin echo-sequence and Spinal-64 1H decoupling of 85 kHz field strength. The free induction decay of 10 ms was acquired using a recycle delay of 60 s. The chemical shifts in the 29Si NMR spectra were referenced to the standard kaolinite peak at −92 ppm. The 1D 27Al spectra were acquired by using single-pulse excitation of 2 µs hard pulses corresponding to a 30° tip angle, recycle delays of 0.1–1 s, and the chemical shifts were referenced to a 1 M AlNO3 solution at 0 ppm. The 1D 23Na NMR spectra were acquired by using single-pulse excitation of 3 µs hard pulses with 1 s recycle delays and referenced to a solid NaCl signal at 0 ppm. All spectra were obtained at room temperature and were deconvoluted using the DMFit software [29].
The solid-state NMR technique enables elucidation of the chemical environments of different NMR active nuclei such as 29Si. In brief, the nuclei of specific atomic isotopes, such as 13C and 29Si are nuclear spin active (a quantum mechanical property). In the presence of a suitably strong magnetic field (7 T in the present case), these atomic nuclei can absorb radiofrequency waves (~59.5 MHz for the 29Si nucleus), which reflect the strength of the magnetic field at the point of the observed nuclei. Electrons, surrounding the nucleus, which generate their own magnetic fields modulate the effective magnetic field strength at the nucleus and therefore allow for precise absorption. In particular, the bonding electrons have a significant effect, as the different types of chemical bonds result in changing electron configurations and, therefore, distinct absorption frequency is observed. These are shown for convenience in parts per million (ppm), i.e., a change of hertz over megahertz frequency range. Thus, in Q0 silicates, where the SiO4 silicate unit does not have any covalent bonds to other silicate or aluminate units (through bridging oxygen linkages) an absorption peak (called the “chemical shift”) is seen at approximately −70 ppm, while in Q4 silicates, where all the oxygen surrounding the central silicon atom are bridging oxygen, a chemical shift of ~−110 ppm is observed. The unique behaviour of these atoms present in geopolymer compositions allows for the use of NMR analysis to study gel formation in these geopolymer systems.

3. Results and Discussion

The results of Series A, in Figure 2, showed that the geopolymer mortars activated using only solid activators can show significantly high compressive strengths under ambient cured conditions. Figure 2a shows that with a decrease in FA/GGBFS ratio, the early age strength (0–7 days) is more rapid. However, conversely at late curing stages (56–91 days) the rate of strength slows down significantly. For the higher FA/GGBFS ratio composition (60/40/0.25), the strength is seen to increase further due to the delayed formation of the NASH gel and its contribution to later-age strength development. Figure 2b shows an increase in the average strength when lower amounts of the activator are used. This is possibly owing to the water content used in the mix being insufficient to dissolve the activator completely. Lastly, Figure 2c shows the rate of strength development and overall compressive strength were higher for compositions with a lower water/binder ratio. Water is required to firstly dissolve the Na2SiO3 activator to begin the geopolymerisation process and secondly to hold these materials together in solution while the gel network is forming and reorganising. However, if too much water is added, it creates a physical barrier separating the particles. Overall, the following variables contributed to the development of a higher compressive strength, namely (a) higher GGBFS content in the binder, (b) lower Na2SiO3 activator content, and (c) lower water content.
From these preliminary results, series B was formulated to further develop and optimise the geopolymer mix design to achieve higher strengths. Additionally, flexural strength and setting time measurements were also conducted to obtain a more comprehensive understanding of the mechanical properties and performance of these compositions. Figure 3 shows the setting time variations for the composition and comparing these results with the 40/60/0.2 composition as the reference, it is seen that varying the FA/GGBFS binder ratio appears to have a stronger effect on the setting times compared to the Na2SiO3/binder ratio.
For the same binder to water ratio, the geopolymer compositions exhibited a much faster setting time than the OPC composition (initial setting time of 180 min and a final setting time of 258 min). Notably, during mixing, the OPC composition was able to be moulded into a ball whereas the geopolymer compositions remained in a viscous liquid state even at low water content. This indicates that geopolymer compositions have a high degree of workability, which would be useful in special applications such as large-scale castings where concrete is required to flow long distances. However, due to the rapid setting nature of the high GGBFS geopolymer mixes, addition of higher amounts of FA or a retarding agent can help to ensure continued flow, although this is likely to cause a decline in the strength. Even if this effect was noted to possibly affect the practical uptake, the product still met the AS 3972 [30] standard requirement of a minimum setting time of 45 min and a maximum setting time of 10 h.
Figure 4 describes the mechanical strength development of Series B over a period of three months. In Figure 4b, the blue and green boxes represent compressive strength ranges of conventional (normal) class and special class OPC compositions at 28 days [31]. As can be seen from the figure, all the geopolymer compositions showed a significantly higher strength compared to normal class OPC; further, the strengths were in the range of special class OPC cements. It should be further noted that, for OPC cements, the strengths tend to stabilise at 28 days and no further significant changes are observed with increasing curing times. However, as can be seen for the geopolymer compositions, the strengths are seen to increase further with increasing curing times.
The rate of strength development is seen to be fastest in the first 7 days after which it decreases between 7 to 28 days and then a much slower increase in strengths is seen between the 28th and 91st day. The differences in the rates of strength development are linked to the type of gel formed and its relative extent within the geopolymer network. The calcium aluminium silicate hydrate (CASH) gel is dominant in the early curing stage while the sodium aluminium silicate hydrate (NASH) gel dominates in the later curing stage. Furthermore, all geopolymer compositions displayed strengths that exceeded the compressive strength standard of 45 MPa for OPC mortars described in the Australian standard AS 3972 [32].
With regard to the effect of the Na2SiO3/binder ratio, an increase in the Na2SiO3 content was seen to increase the mechanical strength, as opposed to what was seen in series A. Similarly, series A achieved its highest strengths with a Na2SiO3/binder ratio of 0.25. This may be attributed to the ratio of Na2SiO3/binder reaching an optimal value at 0.25 after which at higher values, the strength degraded; this suggests that the dissolution of Na2SiO3 reached a maximal limit at this ratio. This limit equates to an approximate Na2SiO3/H2O ratio of 0.48–0.54, as inferred from the highest strengths for compositions with varying Na2SiO3 content in both series A (40/60/0.25–115) and B (40/60/0.24).
Figure 5 and Figure 6 shows micrographs taken at 500× to 3000× magnification of the geopolymer mortars after curing for 56 days. The EDS results showed that with increasing curing time, the dissolved aluminium and sodium ions from the activator are integrated into the CSH gel, thereby creating a hybrid calcium/sodium-aluminosilicate hydrate (C/N-ASH) gel. Furthermore, the data show that slag particles react more easily and thus form part of the gel phase compared to the fly ash particles; this is expected from the higher reactivity of the slag particles and their smaller average particle sizes. Some cracks are visible within the microstructure and these arise from the loss of water from the compositions and rapid shrinkage during curing in the absence of large aggregates that are generally present in concrete compositions.
Comparing the SEM images of 45/55/0.2 and 35/65/0.2 samples in Figure 5, it was found that with an increase in GGBFS binder ratio, the microstructure appeared to become smoother and more homogenous with a reduction in the overall porosity and pore sizes. The difference in sizes of the pores indicate that these may be created from the consumption of different binder particles to form the gel phase; the consumption of large FA particles or the presence of trapped air/gas bubbles is evidenced through the presence of round pores while particle packing voids are present as irregularly shaped pores. The inner regions of the round pores contain solid raw material indicating that the dissolution of the FA particle started from the outside and then the reactions moved inwards. As reactions occurred, the increasing formation of the gel would increase the viscosity of the activator, thereby slowing the kinetics of strength development owing to the reduced consumption of raw materials.
Additionally, these pores were largely filled with angular particles, which may be quartz particles present in FA, which are less reactive while the thin, plate-like particles represent the crystalline CSH gel. Because of the high CaO content in GGBFS, it drastically quickens the reaction rate, resulting in faster setting times. Therefore, any remnant air bubbles or gases formed from reaction would be trapped inside and cannot escape from the setting gel matrix. The decrease in porosity results from GGBFS naturally having, on average, a finer particle size than FA as shown in Table 4, resulting in better packing density. Due to a more rapid development of CSH gel, the 35/65/0.2 composition shows the presence of higher numbers of crystalline particles.
The microstructural features of compositions 40/60/0.16 and 40/60/0.24 are compared in Figure 6 and it was seen that the increase in Na2SiO3 content had a similar effect to the increase in GGBFS binder ratio, resulting in a lower porosity, smoother surface, formation of angular CSH particles, and more homogenous matrix. However, with the increased CSH gel formation, fine cracks appear to have developed in greater numbers possibly due to shrinkage cracks from rapid water loss and gel formation.
These results are supported by the XRD data shown in Figure 7a, where the CSH peak at 29° 2θ for the 35/65/0.2 composition showed a slight increase compared to the 45/55/0.2 composition. Furthermore, XRD data for the samples with increasing Na2SiO3/binder ratio, shown in Figure 7b, showed that the 40/60/0.24 composition again showed a slightly higher CSH peak at 29° 2θ compared to the 40/60/0.16 composition. Conversely, to what was observed with the CSH peak, the NASH hump at ~32° 2θ appeared to be slightly more visible in compositions 45/55/0.2 and 40/60/0.16, which had a higher ratio of FA/GGBFS and lower Na2SiO3/binder, respectively. In addition to these phases, the XRD patterns expectedly showed the presence of both quartz and mullite as the major crystalline phases. Since these phases are inherently present in the fly ash, the amounts of these phases decreased with decrease in the fly ash content. On the other hand, changes in the metasilicate amounts were observed to have no significant impact on the peak intensities of the phases formed or present. Trace peaks representing unreacted sodium metasilicate can also be seen in all the compositions.
29Si NMR was conducted on anhydrous FA, anhydrous GGBFS, 7-day and 91-day cured geopolymer paste samples to understand the structural changes in the samples. These results are summarised in Figure 8, Figure 9, Figure 10, Figure 11 and Figure 12 and Table 7 and Table 8. The signals located around −75, −80, −82, −85, and −88 ppm were associated with Q1 (raw slag), Q1, Q2(1Al), Q2(0Al), and Q3(1Al) units, respectively; the latter four represent CASH gel formation. The signals observed at ~−90, −95, −97, −105, and −108 ppm were associated with Q4(4Al), Q4(3Al), Q4(2Al), Q4(1Al) and Q4(0Al) units, respectively, which represent NASH gel formation. These two ranges correspond to the range of values observed for the anhydrous FA and anhydrous GGBFS (i.e., raw materials prior to activation), shown in Figure 8. The signals at −109 and −114 ppm are associated with quartz and mullite, respectively. From the data, it can be seen that GGBFS consists mainly of low-Q silicate species (highly amorphous), whilst anhydrous FA consists mainly of high-Q silicate species (crystalline species such as quartz and mullite). As a result, the FA is expected to have a much slower activation rate than the GGBFS.
From the NMR data for the 7-day cured compositions, some general trends can be observed. The increase in GGBFS content does not cause a significant change in the CASH gel amount with compositions 45/55/0.2 and 35/65/0.2 showing values of 44.59% and 44.88%, respectively. Increase in the amount of Na2SiO3 increased the CASH content with compositions 40/60/0.16 and 40/60/0.24 showing integrals of 43.10% and 48.86%, respectively. This indicates that the lower Na2SiO3 amount limits the rate of slag activation and its conversion into CASH gel. Even though CSH formation would be influenced principally by the presence of slag, the substitution of Al from the fly ash into the CSH gel to form CASH gel is enhanced only in the presence of higher amounts of the alkaline activator. Although the NASH proportions show variations, there is a significant error in the evaluation of those sites due to their low signal to noise ratio and their inherently slow reaction rates. Additionally, much of the NASH signal is likely to be unreacted FA.
The positive effect of Na2SiO3 in forming the CASH gel is further supported when examining the 91-day cured compositions. The 40/60/0.16 and 40/60/0.24 compositions now show CASH gel values of 52.92% and 60.72%, respectively. Furthermore, the effect of slag content on CASH gel formation is observed to be clearer in the compositions cured for 91 days. Compositions 45/55/0.2 and 35/65/0.2 show a significant difference in CASH content (~35.7% and ~65.9%, respectively) and this could be related to the effect of greater curing time in allowing increased reactions between the fly ash and sodium silicate activator leading to increased incorporation of Al in the CSH gel, resulting in increased CASH gel formation.
The 7-day and 91-day samples show narrower, higher intensity peaks within the range of −70 to −90 ppm as compared to the range of −90 to −110 ppm. In Table 7 and Table 8, the width of the peak is recorded as the full width at half maximum height (FWHM) of the peak, and the narrower a peak, the more ordered the structure. The highly ordered structure of the CASH gel is supported by the previously observed crystalline CSH peaks observed in XRD analysis of these compositions.
The higher integral of the Q2(0Al) peak, at −85 ppm, demonstrates the increased availability of Si for the reactions. In the 91-day cured compositions 45/55/0.2 and 35/65/0.2, this peak showed integrals of 8.65% and 13.78%, respectively, whereas in compositions 40/60/0.16 and 40/60/0.24, it showed integrals of 4.20% and 17.17%, respectively. Therefore, the data demonstrates that an increase in GGBFS and Na2SiO3 content leads to an increase in free Si available for the geopolymerisation reactions. The hybrid N(CASH) gel formed in all compositions exhibits features from both gels, with the Q1, Q2(1Al), Q2(0Al), and Q3(1Al) peaks representing the CASH environments while the Q4(4Al), Q4(3Al), Q4(2Al), Q4(1Al), and Q4(0Al) represent the NASH environments. Taking an integral of the CASH and NASH peaks, it is seen that ~70% of the structure is the CASH gel for the 35/65/0.2 and 40/60/0.16 compositions (with the rest being NASH gel), while it is ~35% for 45/55/0.2 and ~50% for 40/60/0.24 compositions. This shows that higher slag contents tend to increase the CASH gel proportion while increasing metasilicate amounts tend to increase the NASH gel proportion, although lower metasilicate amounts would again impact on the extent of CASH gel formation.
The utilisation of Al in gel formation is also apparent in all samples, with the intensity of the highly ordered Q2(1Al) demonstrating an Al-rich CASH structure, while there is a more Al-deficient NASH gel structure, with reduced intensities or complete absence of the Al-substituted framework sites at the Q4(4Al), Q4(3Al), Q4(2Al), Q4(1Al), and Q4(0Al) peaks. Compositions 45/55/0.2 and 40/60/0.16 had similarly low Q2(1Al) peak intensities of 40.31 and 41.49, respectively, as compared to the much higher intensities of 35/65/0.2 and 40/60/0.2 at 102.87 and 104.23, respectively. The data show that Al addition to the CASH gel is enhanced with increased slag addition at the expense of its incorporation in the NASH gel.
Therefore, the sustained increase in late age strength (56 to 91 days) is due to the formation of additional NASH structures. In compositions with higher FA/GGBFS ratio and increased Na2SiO3/binder ratio, the rate of strength development between 56 to 91 curing days appears to be at a very gradual rate in comparison to the compositions with lower FA/GGBFS ratio and decreased Na2SiO3/binder ratio. Thermodynamic calculations show that most Al(IV)-O-Si bonds are more readily broken than Si-O-Si bonds and bonds between network-forming and network-modifying species, such as Si-O-Na and Si-O-Ca, are weaker [27]. This energetic difference controls the availability of Al for gel coagulation and the subsequent characteristics such as strength development, setting and microstructural features. This highlights the need for high molarities when activating FA based geopolymers, as the higher molarity will allow greater dissolution of the Si-O-Si bonds in the FA glass. This explains the observation of the more intense Q4(0Al) peak in the 40/60/0.24 composition with higher amounts of Na-silicate, as there is more Si available for geopolymerisation reactions.
From these observations, it can be seen that the increase in both GGBFS and Na2SiO3 can result in high compressive strengths of ~81 MPa and ~78 MPa, for the 35/65/0.2 and 40/60/0.24 compositions, respectively, with these compositions also showing comparable initial (~63 min /~63 min) and final setting times (~77 min /~75 min). The work was, thus, able to establish the key chemical factors affecting the strength development and demonstrate the viability of fabricating high strength geopolymer mortar products with very high strengths using solid activators.

4. Summary and Conclusions

In the present work, solid sodium metasilicate was successfully trialled in an add-water style dry cement mix for laboratory-scaled mortar samples. The effect of binder ratio, activator/binder ratio, and water/binder ratio on its flexural strength, compressive strength, and setting time were examined. The major findings are as follows:
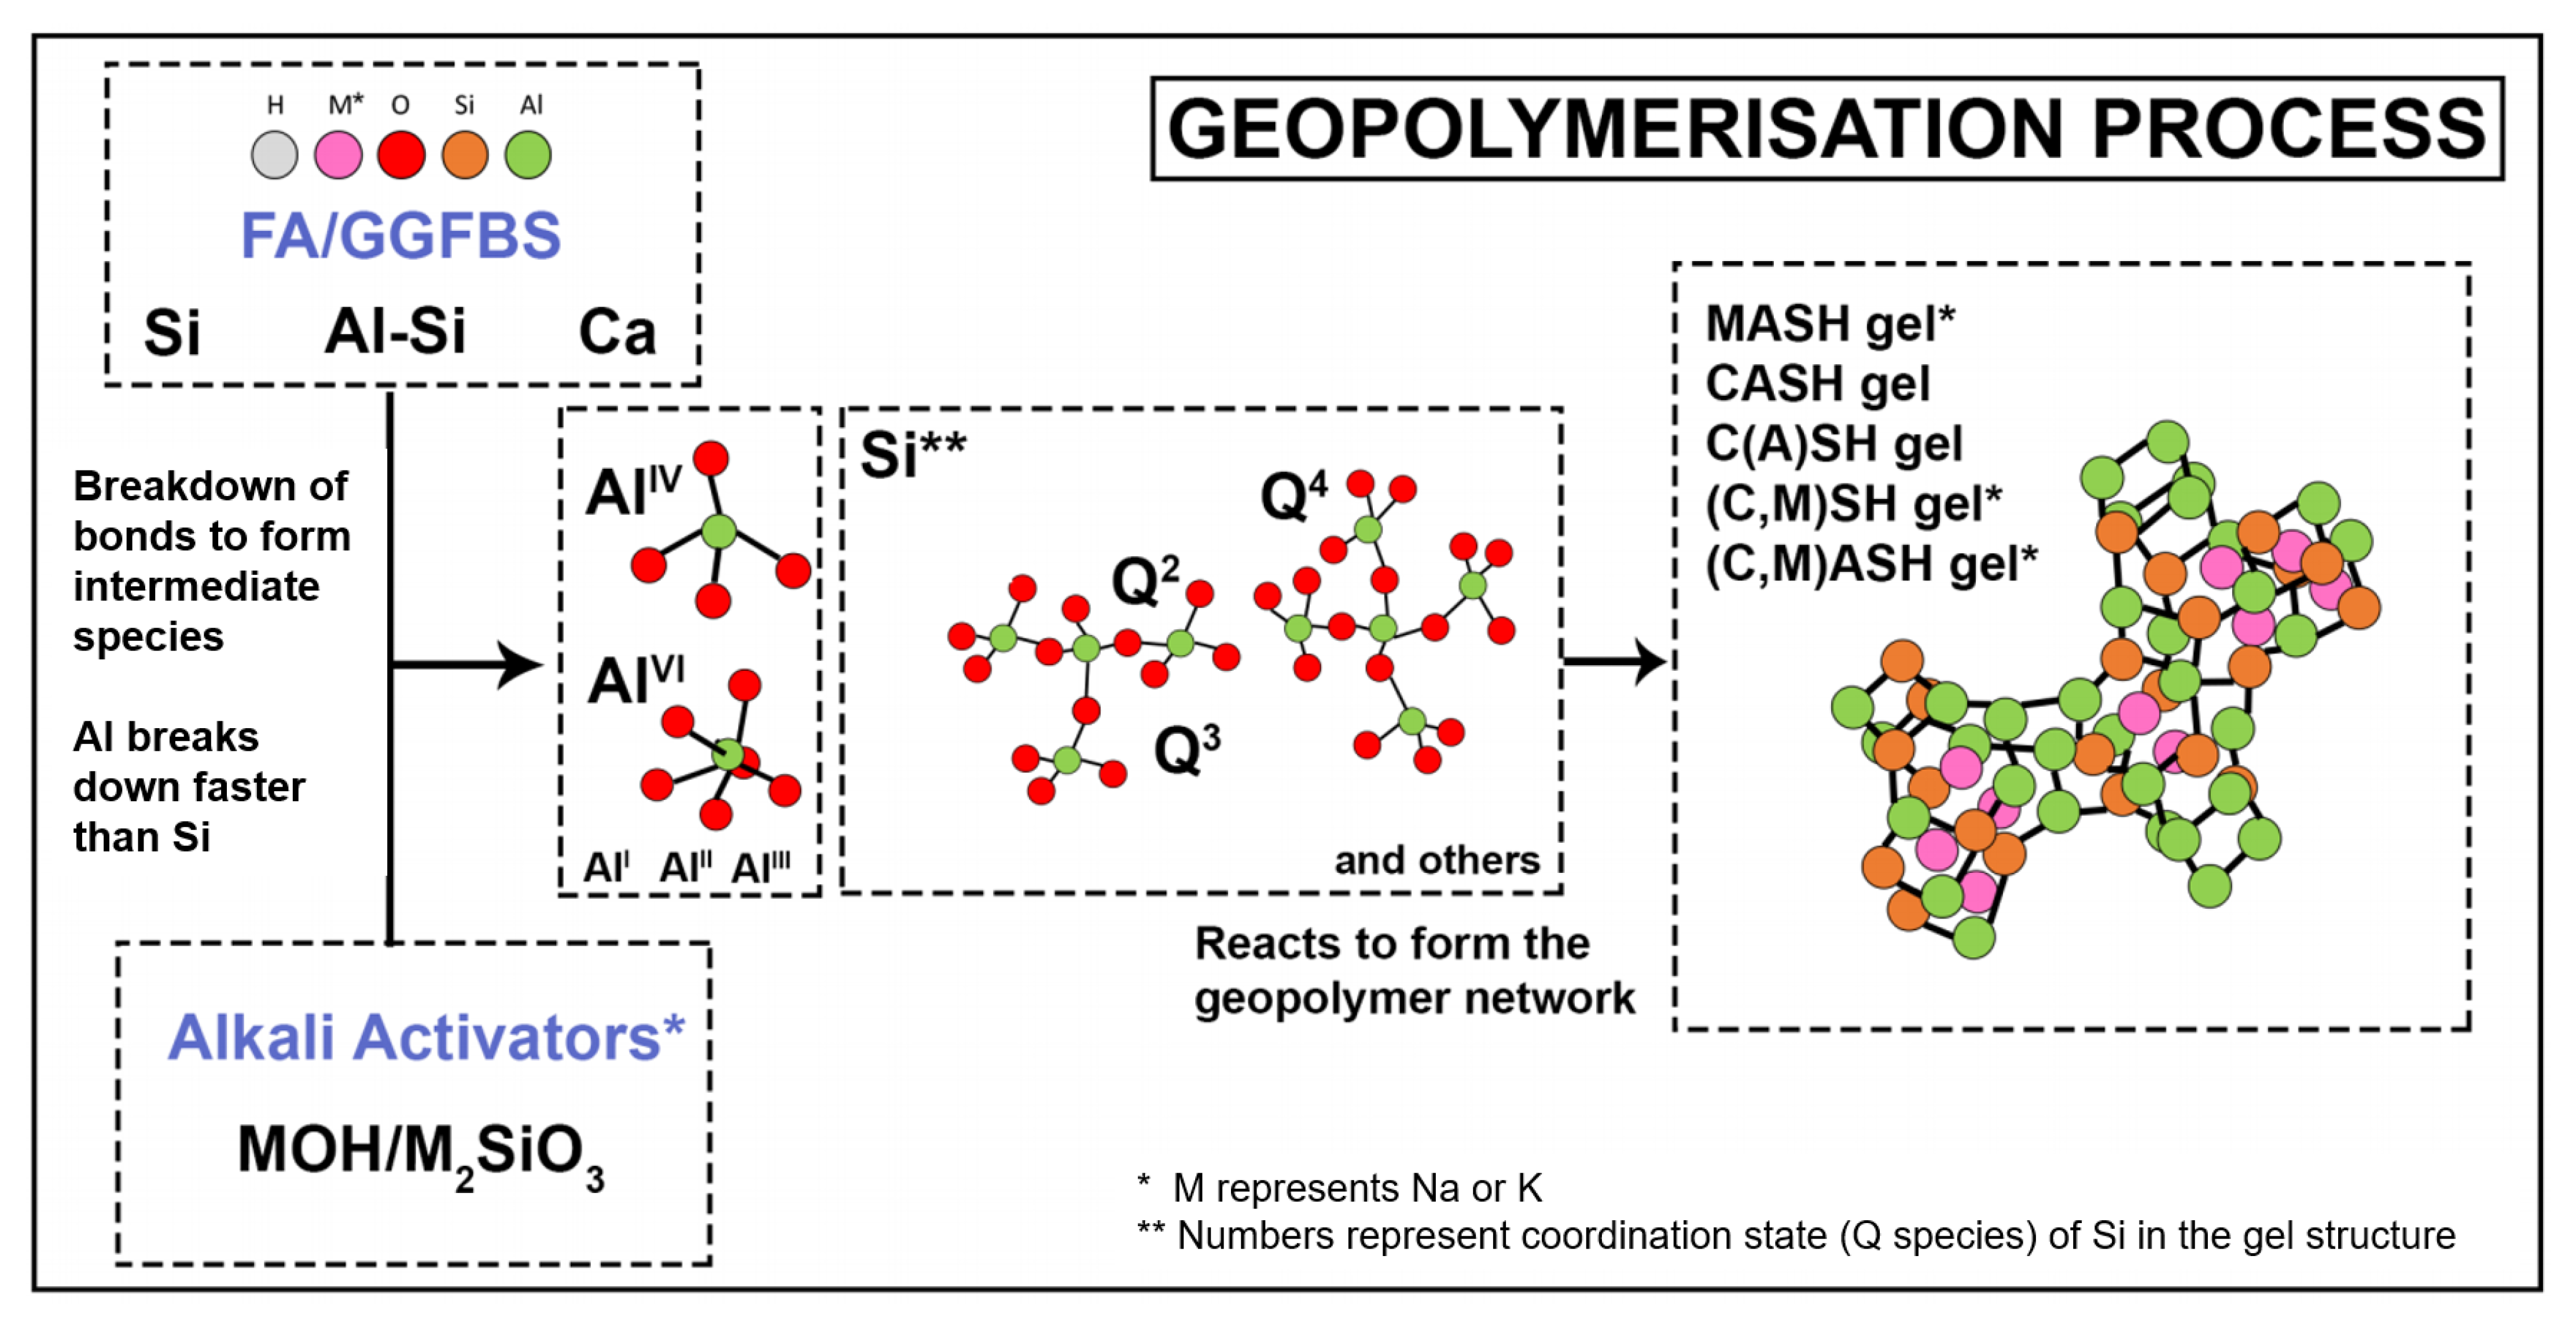
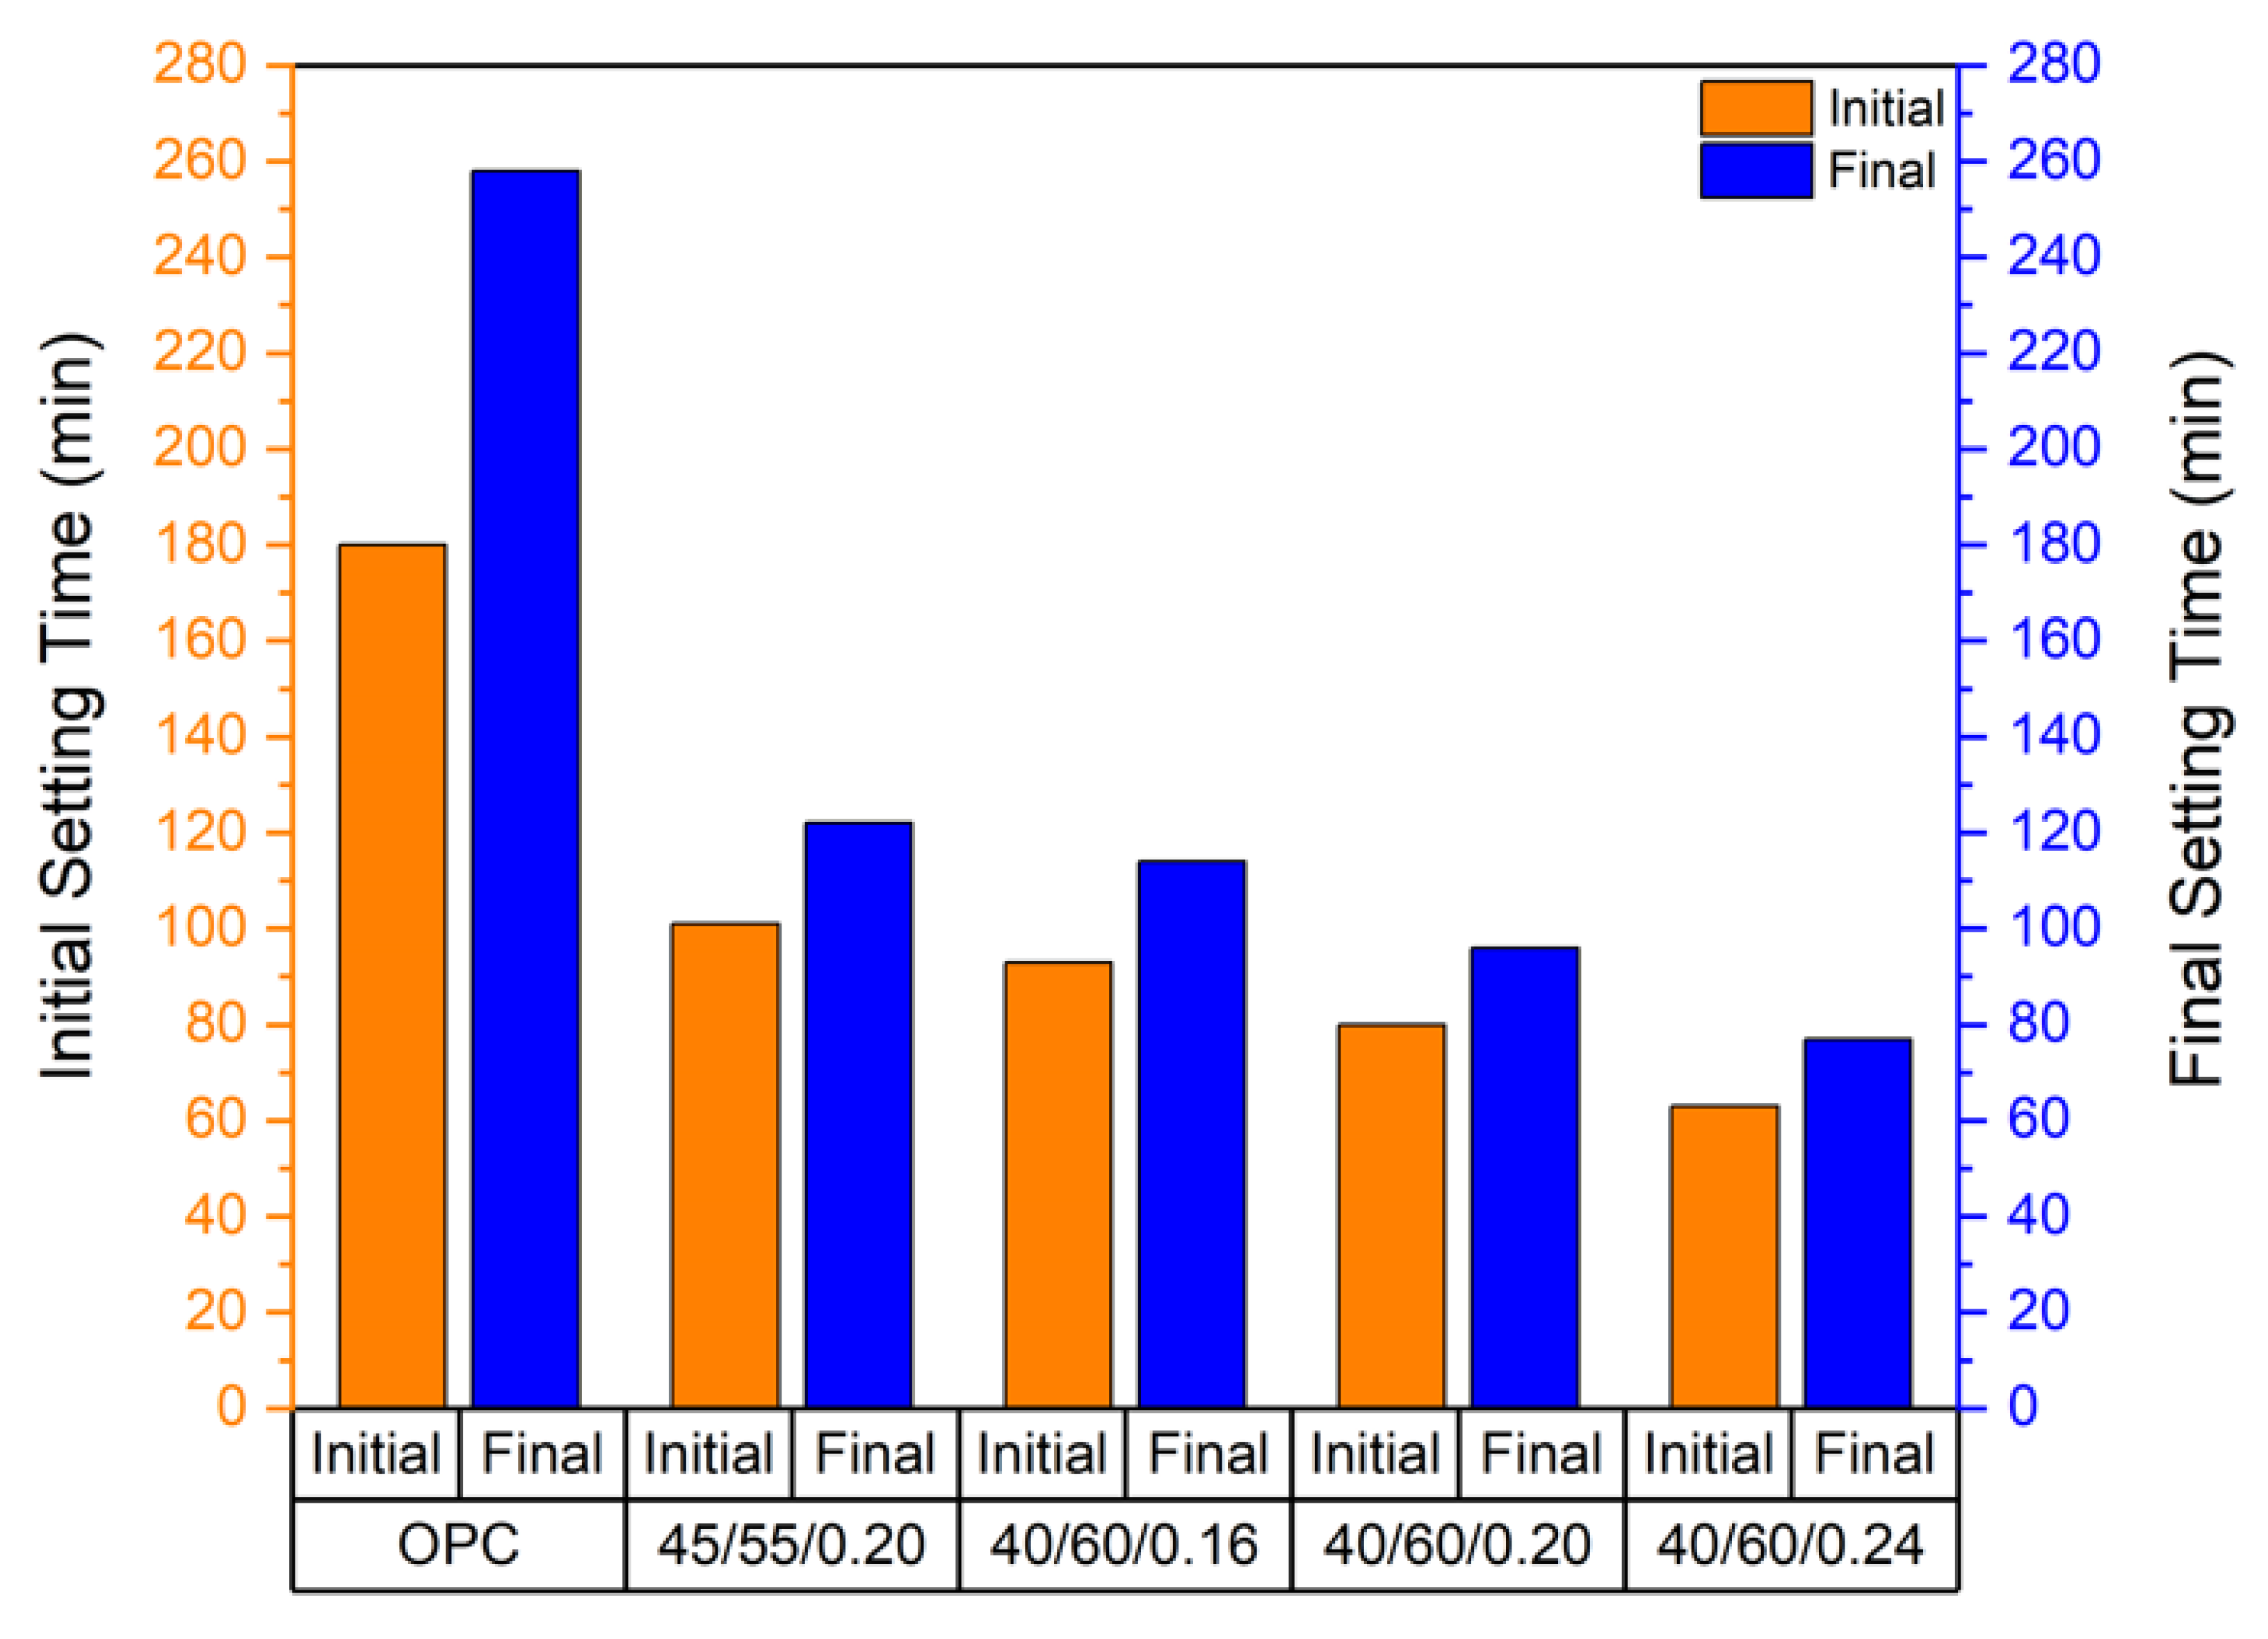
  • Owing to the higher reactivity of the GGBFS to the FA, the initial and final setting times were shorter for compositions with higher GGBFS contents compared to those with higher FA content.
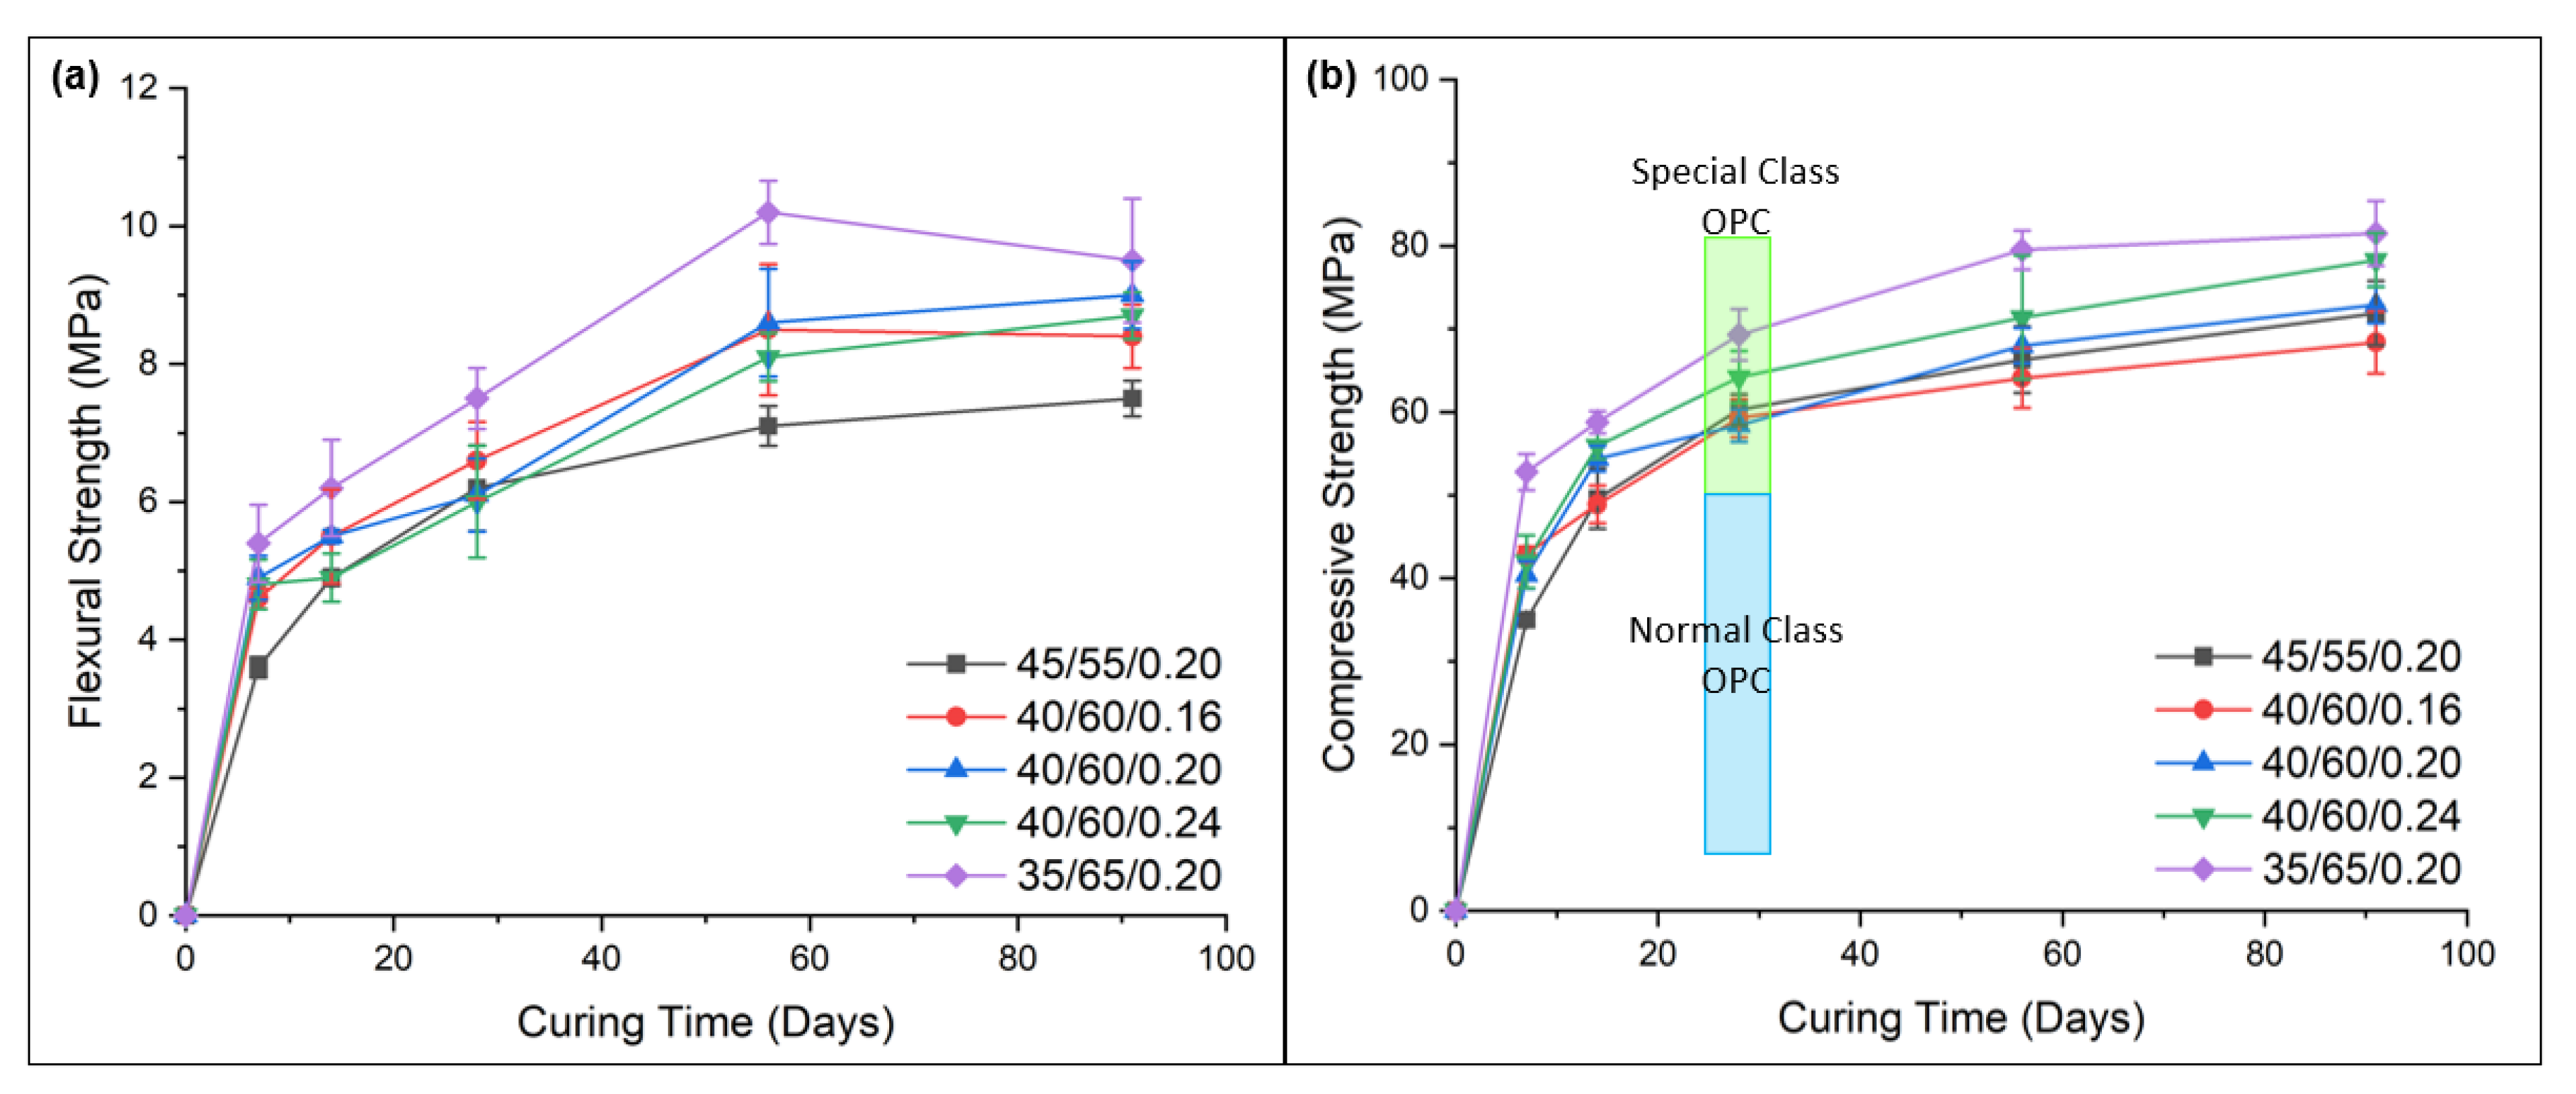
  • Powder activators in pre-dry mixed geopolymer cements helped to produce mortars with flexural and compressive strengths of up to ~9 MPa and ~80 MPa at 91-days, respectively. The compressive strength values were superior to the OPC control sample, which showed ~55 MPa at 91-days. Thus, these geopolymers activated using solid sodium metasilicate were observed to be a viable alternative to conventional OPC.
  • Mixes with a higher ratio of GGBFS had a greater bulk density, with reduced porosity due to inferior particle packing, which in turn increased its compressive and flexural strength.
  • All samples displayed similar mineralogical constituents at all tested curing points, but with slight differences in their amounts. Higher intensities of the CSH gel were observed with increase in the GGBFS content and Na2SiO3 content in the samples, and a slightly larger hump of the NASH gel was observed with increased FA content and decreased Na2SiO3 content.
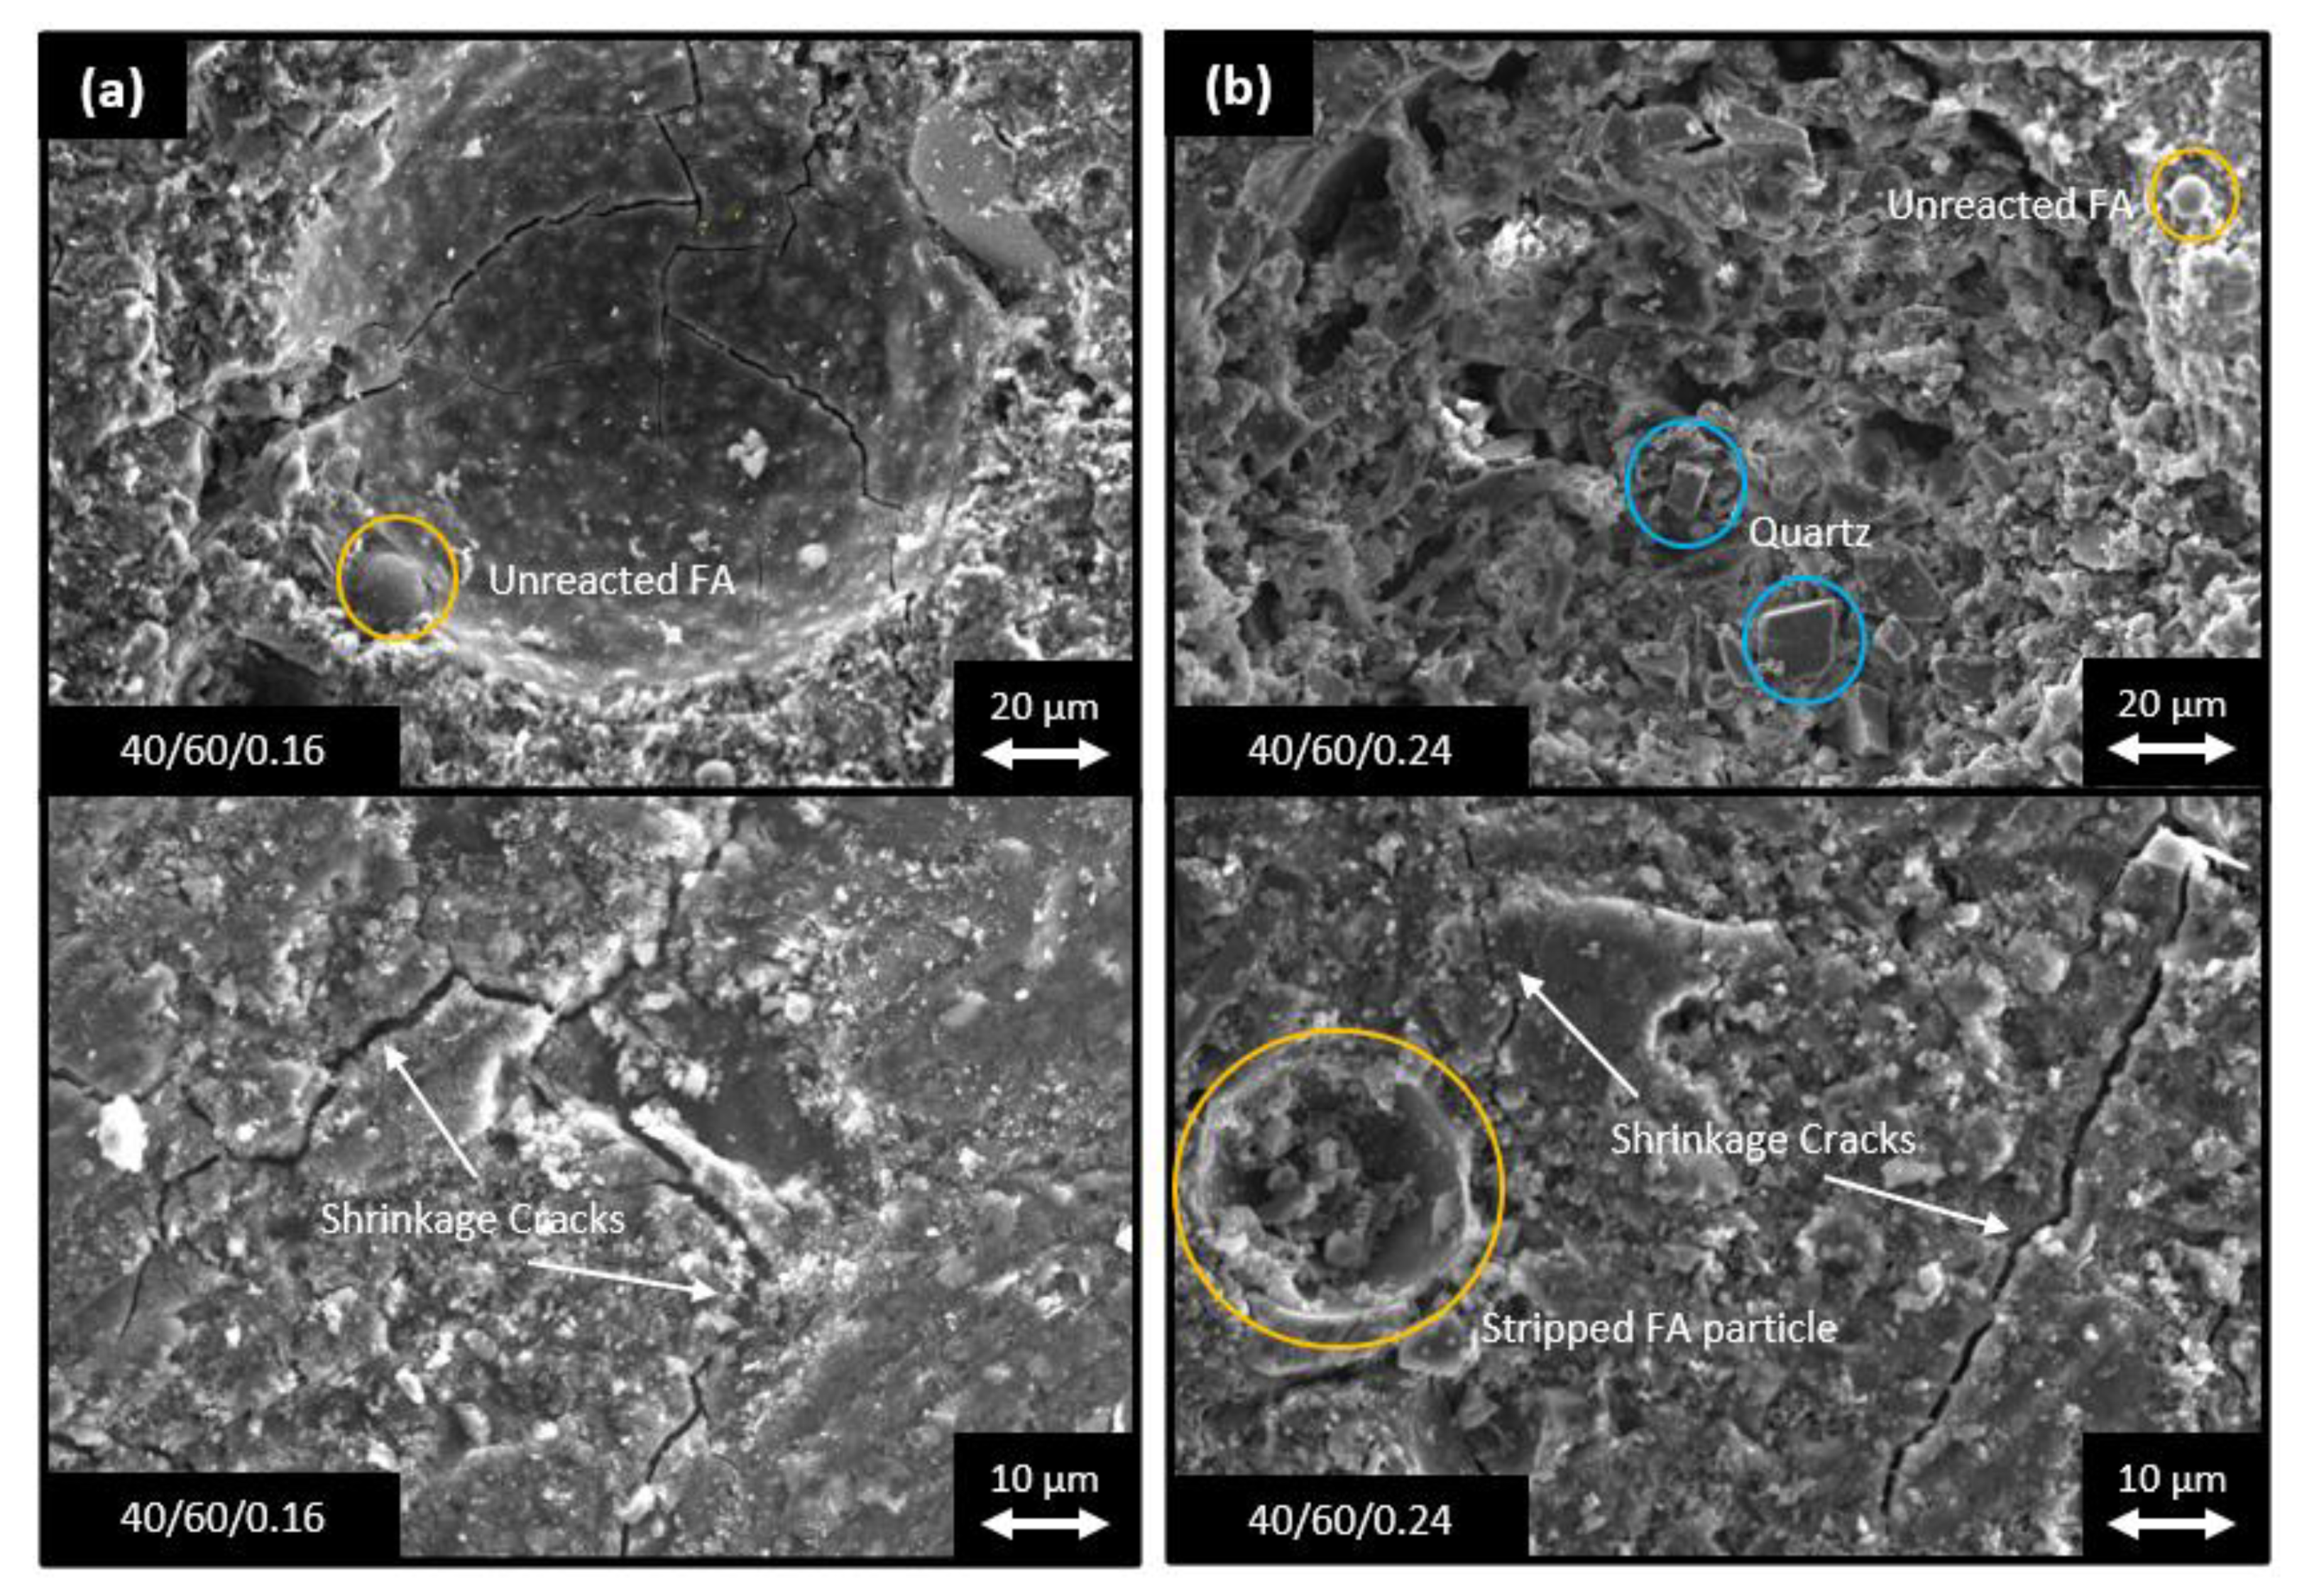
  • High GGBFS-containing compositions produced higher mechanical strengths than those with higher FA contents. Samples with high GGBFS proportions in the binders exhibited significantly greater early age compressive strengths, i.e., 52.8 MPa for 35/65/0.2 at 7-days curing vs. 35.0 MPa for 45/55/0.2 for the same curing time. This was attributed to the smaller particle sizes and higher CaO content of the GGBFS, which contributed to higher reactivity and greater density and homogeneity of the matrix. However, higher amounts of slag resulted in increased numbers of fine cracks being present from rapid gel formation.
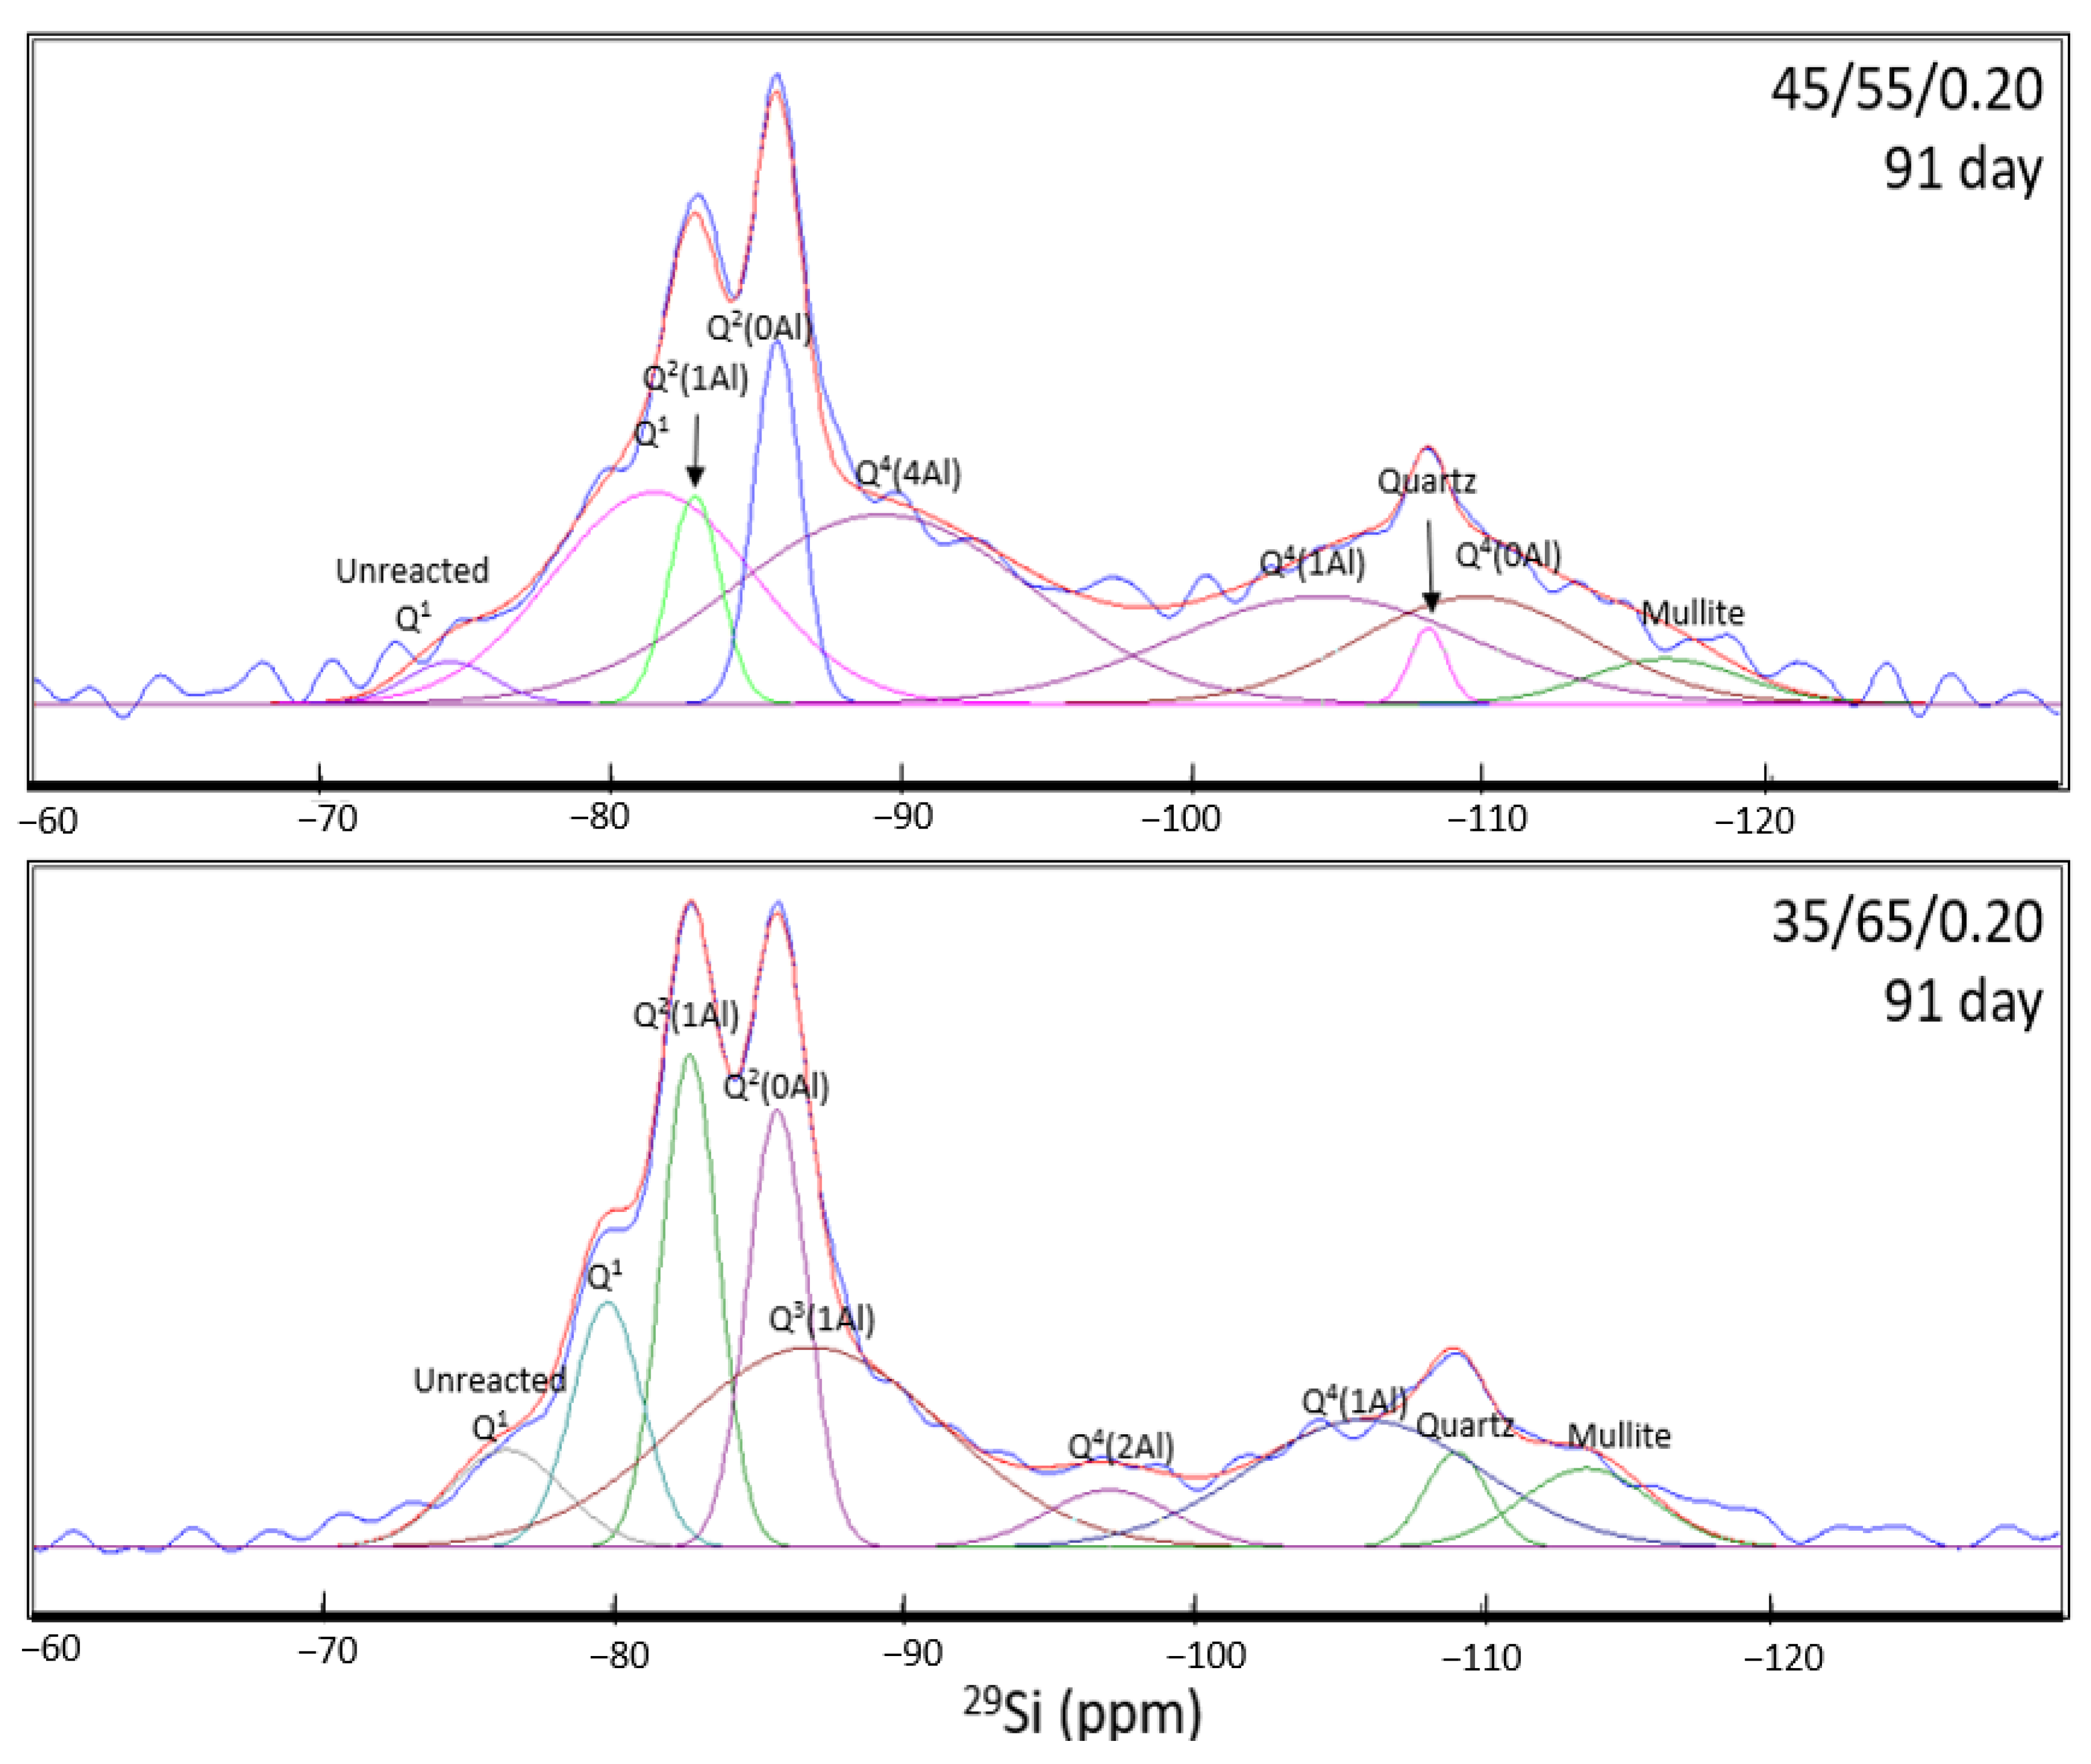
  • NMR analysis revealed that the anhydrous GGBFS consists mainly of low-Q silicate species, whilst anhydrous FA consists mainly of high-Q silicate species. As a result, the FA is expected to have a much slower activation rate than the GGBFS. Therefore, through the deconvolution of the spectra for the 7-day and 91-day cured samples, higher slag content and higher amounts of metasilicate activator increased the proportion of CASH gel formed owing to the faster reactions of the slag and the effect of the sodium silicate in opening the CSH structure to allow for Al incorporation. NASH gel formation occurred at a slower rate and contributed to late-age strength development. Furthermore, the NASH gel was observed to be Al-deficient owing to the competing Al incorporation in the CASH gel network.
The work was able to demonstrate that geopolymer compositions could be produced by activation solely by solid sodium metasilicate (Na2SiO3). This approach can thus reduce the possible hazardous risks that arise from the use of high alkalinity sodium hydroxide (NaOH) and further enable the possibility of implementing geopolymer compositions with add-water style characteristics to OPC on an industrial scale.

Author Contributions

Data curation, V.W., W.J. (William Jervis), W.J. (William Joe) and A.R.; Formal analysis, V.W., W.J. (William Jervis), A.R. and P.K.; Methodology, V.W., B.F., T.N., W.J. (William Joe) and P.K.; Resources, B.F., T.N., C.C.S. and P.K.; Supervision, B.F. and P.K. All authors have read and agreed to the published version of the manuscript.

Funding

This research received no external funding.

Institutional Review Board Statement

Not applicable.

Informed Consent Statement

Not applicable.

Data Availability Statement

Not applicable.

Acknowledgments

The authors are grateful to Brickworks for technical assistance and provision of raw materials and to Australian Steel Mill Services for providing the ground granulated blast furnace slag. The authors also acknowledge the support of the Mark Wainwright Analytical Centre, UNSW Sydney for the subsidised facilities for characterisation.

Conflicts of Interest

There are no conflict of interest to declare.

References

  1. Hemmings, R.T.; Berry, E.E. On the Glass in Coal Fly Ashes: Recent Advances; McCarthy, G.J., Glasser, F.P., Roy, D.M., Hemmings, R.T., Eds.; Cambridge University Press: Cambridge, UK, 1987; p. 113. [Google Scholar]
  2. Criado, M.; Aperador, W.; Sobrados, I. Microstructural and mechanical properties of alkali activated colombian raw materials. Materials 2016, 9, 158. [Google Scholar] [CrossRef] [PubMed] [Green Version]
  3. ASTM C618-19. Standard Specification for Coal Fly Ash and Raw or Calcined Natural Pozzolan for Use in Concrete; ASTM International: West Conshohocken, PA, USA, 2019. [Google Scholar]
  4. Kosmatka, S.; Kerkhoff, B.; Panarese, W. Chapter 3: Fly ash, slag, silica fume, and natural pozzolans. In Design and Control of Concrete Mixtures; Portland Cement Association: Skokie, IL, USA, 2002; pp. 57–72. [Google Scholar]
  5. Provis, J.L.; Bernal, S.A. Geopolymers and related alkali-activated materials. Annu. Rev. Mater. Res. 2014, 44, 299–327. [Google Scholar] [CrossRef]
  6. Stutzman, P.E.; Centeno, L. Compositional Analysis of Beneficiated Fly Ashes; National Institute of Standards and Technology: Gaithersburg, MD, USA, 1995.
  7. Yeoh, M.L.Y.; Ukritnukun, S.; Rawal, A.; Davies, J.; Kang, B.J.; Burrough, K.; Aly, Z.; Dayal, P.; Vance, E.R.; Gregg, D.J.; et al. Mechanistic Impacts of long-term gamma irradiation on physicochemical, structural, and mechanical stabilities of radiation-responsive geopolymer pastes. J. Hazard. Mater. 2002, 407, 124805. [Google Scholar] [CrossRef] [PubMed]
  8. Ukritnukun, S.; Koshy, P.; Rawal, A.; Castel, A.; Sorrell, C.C. Predictive model of setting times and compressive strengths for low-alkali, ambient-cured, fly ash/slag-based geopolymers. Minerals 2020, 10, 920. [Google Scholar] [CrossRef]
  9. Shah, S.F.A.; Chen, B.; Oderji, S.Y.; Haque, M.A.; Ahmad, M.R. Improvement of early strength of fly ash-slag based one-part alkali activated mortar. Constr. Build. Mater. 2020, 246, 118533. [Google Scholar] [CrossRef]
  10. Luukkonen, T.; Abdollahnejad, Z.; Yliniemi, J.; Kinnunen, P.; Illikainen, M. One-part alkali-activated materials: A review. Cem. Concr. Res. 2018, 103, 21–34. [Google Scholar] [CrossRef]
  11. Li, C.; Sun, H.; Li, L. A review: The comparison between alkali-activated slag (Si+Ca) and metakaolin (Si+Al) cements. Cem. Concr. Res. 2010, 40, 1341–1349. [Google Scholar] [CrossRef]
  12. Palomo, A.; Fernández-Jiménez, A.; Kovalchuk, G.U.; Ordoñez, L.M.; Naranjo, M.C. OPC-fly ash cementitious systems: Study of gel binders produced during alkaline hydration. J. Mater. Sci. 2007, 42, 2958–2966. [Google Scholar] [CrossRef]
  13. Shi, C.; Roy, D.; Krivenko, P. Alkali-Activated Cements and Concretes, 1st ed.; CRC Press: London, UK, 2003. [Google Scholar]
  14. Hajimohammadi, A.; van Deventer, J.S.J. Characterisation of one-part geopolymer binders made from fly ash. Waste Biomass Valorization 2017, 8, 225–233. [Google Scholar] [CrossRef]
  15. Yang, K.H.; Song, J.K. Workability loss and compressive strength development of cementless mortars activated by combination of sodium silicate and sodium hydroxide. J. Mater. Civil Eng. 2009, 21, 119–127. [Google Scholar] [CrossRef]
  16. Yahya, Z.; Abdullah, M.M.A.B.; Kamarudin, H.; Nizar, K.; Razak, R.A.; Sandu, A.V. Effect of solids to liquids, Na2SiO3 to NaOH and curing temperature on the palm oil boiler ash (Si + Ca) geopolymerisation system. Materials 2015, 8, 2227–2242. [Google Scholar] [CrossRef]
  17. Provis, J. Chapter 4: Activating solution chemistry for geopolymers. In Geopolymers: Structures, Processing, Properties and Industrial Applications; Woodhead Publishing Series in Civil and Structural Engineering; Elsevier Science B.V.: Amsterdam, The Netherlands, 2009; pp. 50–71. [Google Scholar]
  18. Garcia-Lodeiro, I.; Palomo, A.; Fernández-Jiménez, A.; Macphee, D.E. Compatibility studies between N-A-S-H and C-A-S-H gels: Study in the ternary diagram Na2O-CaO-Al2O3-SiO2-H2O. Cem. Concr. Res. 2011, 41, 923–931. [Google Scholar] [CrossRef]
  19. Lodeiro, I.G.; Macphee, D.E.; Palomo, A.; Fernández-Jiménez, A. Effect of alkalis on fresh C–S–H gels: FTIR analysis. Cem. Concr. Res. 2009, 39, 147–153. [Google Scholar] [CrossRef]
  20. Palomo, A.; Krivenko, P.; Garcia-Lodeiro, I.; Kavalerova, E.; Maltseva, O.; Fernandez-Jimeneza, A. A review on alkaline activation: New analytical perspectives. Mater. Constr. 2014, 64, e022. [Google Scholar] [CrossRef] [Green Version]
  21. VUTChempoint. Geopolymerisation Mechanism. 2011. Available online: https://www.youtube.com/watch?v=_BX8E0IEkVI (accessed on 20 June 2020).
  22. Duxson, P.; Fernández-Jiménez, A.; Provis, J.L.; Lukey, G.C.; Palomo, A.; van Deventer, J.S.J. Geopolymer technology: The current state of the art. J. Mater. Sci. 2007, 42, 2917–2933. [Google Scholar] [CrossRef]
  23. Yang, K.H.; Song, J.K.; Ashour, A.F.; Le, E.T. Properties of cementless mortars activated by sodium silicate. Constr. Build. Mater. 2008, 22, 1981–1989. [Google Scholar] [CrossRef] [Green Version]
  24. Yang, K.H.; Song, J.K.; Lee, K.S.; Ashour, A.F. Flow and compressive strength of alkali-activated mortars. ACI Mater. J. 2009, 106, 50–58. [Google Scholar]
  25. Yang, K.H.; Song, J.K.; Lee, J.S. Properties of alkali-activated mortar and concrete using lightweight aggregates. Mater. Struct. 2010, 43, 403–416. [Google Scholar] [CrossRef]
  26. ASTM C348-20. Standard Test Method for Flexural Strength of Hydraulic-Cement Mortars; ASTM International: West Conshohocken, PA, USA, 2020. [Google Scholar]
  27. ASTM C109/109M-20a. Standard Test Method for Compressive Strength of Hydraulic Cement Mortars (Using 2-in. or [50-mm] Cube Specimens); ASTM International: West Conshohocken, PA, USA, 2020. [Google Scholar]
  28. ASTM C191-19. Standard Test Methods for Time of Setting of Hydraulic Cement by Vicat Needle; ASTM International: West Conshohocken, PA, USA, 2019. [Google Scholar]
  29. Massiot, D.; Fayon, F.; Capron, M.; King, I.; le Calvé, S.; Alonso, B.; Durand, J.O.; Bujoli, B.; Gan, Z.; Hoatson, G. Modelling one and two-dimensional solid-state NMR spectra. Magn. Reson. Chem. 2002, 40, 70–76. [Google Scholar] [CrossRef]
  30. AS 3972. General Purpose and Blended Cements; Standards Australia: Sydney, Australia, 2010. [Google Scholar]
  31. Datasheet—Specifying Concrete; Cement, Concrete and Aggregates Australia (CCAA): Mascot, Australia, 2017; pp. 1–4.
  32. Duxson, P.; Provis, J.L. Designing precursors for geopolymer cements. J. Am. Ceram. Soc. 2008, 91, 3864–3869. [Google Scholar] [CrossRef]
Figure 1. Reaction process of aluminosilicate dissolution in the activator solution leading to the formation of a geopolymer network (Adapted from [22]).
Minerals 11 00143 g001
Figure 2. Series A—Effect of (a) FA/GGBFS ratio, (b) Na2SiO3/binder ratio, and (c) water/binder ratio on compressive strength.
Minerals 11 00143 g002
Figure 3. Setting time of geopolymer compositions in comparison to ordinary Portland cement (OPC).
Minerals 11 00143 g003
Figure 4. Series B—Variation in (a) flexural strength and (b) compressive strength of geopolymer compositions (comparison is shown for 28 day compressive strengths with different OPC grades).
Minerals 11 00143 g004
Figure 5. Secondary electron SEM images showing the microstructural features of geopolymer mortar compositions at different binder ratios—35/65/0.2 (a) and 45/55/0.2 (b) after curing for 56 days.
Minerals 11 00143 g005
Figure 6. Secondary electron SEM images of the microstructural features of geopolymer mortar compositions at different Na2SiO3/binder ratios—40/60/0.16 (a) and 40/60/0.24 (b) after curing for 56 days.
Minerals 11 00143 g006
Figure 7. XRD patterns for 91-day cured samples for (a) varying FA/GGBFS binder ratio and (b) varying Na2SiO3/binder ratio.
Minerals 11 00143 g007
Figure 8. 29Si NMR spectra of anhydrous FA and GGBFS.
Minerals 11 00143 g008
Figure 9. Deconvoluted 29Si NMR spectra for geopolymer pastes with varying FA/GGBFS binder ratio at 7 days.
Minerals 11 00143 g009
Figure 10. Deconvoluted 29Si NMR Spectra for eopolymer pastes with varying Na2SiO3/binder ratio at 7 days.
Minerals 11 00143 g010
Figure 11. Deconvoluted 29Si NMR spectra for eopolymer pastes with varying FA/GGBFS binder ratio at 91 days.
Minerals 11 00143 g011
Figure 12. Deconvoluted 29Si NMR spectra for eopolymer pastes with varying Na2SiO3/binder ratio at 91 days.
Minerals 11 00143 g012
Table 1. Geopolymer compositions activated using solid activators and their ultimate compressive strength (UCS) at different curing times.
BinderAggregate TypeFA:BFS Ratio(Na2O)x•(SiO2)y
/Binder Ratio
NaOH/Binder RatioSilicate Modulus MsH2O/Binder RatioCuring Temp. (°C)7 d UCS [MPa]28 d UCS [MPa]56 d UCS [MPa]Ref.
FANone100:00.3770.066N/A0.4904042.057.0--[14]
FASand100:00.1550.0020.900.603231.53.55.0[15]
BFSSand0:1000.1550.0020.900.5862338.549.658.4
FASand100:00.485--0.900.742233.29.514.0[23]
BFSSand0:1000.485--0.900.7422347.151.358.4
FASand100:0N/AN/A0.750.500230.52.202.5[24]
BFSSand0:100N/AN/A0.750.5002342.148.651.5
BFSSand0:100N/A--0.900.5002348.161.162.8
BFSClay Granule0:1000.215--0.900.4872349.353.862.1[25]
FA/BFSSand50:500.100--0.920.30030~62.0~83--[9]
FA/BFSSand60:400.100 --0.920.30020~55.0~80--
* N/A = not available or provided clearly in paper; ** dash (--); = not tested.
Table 2. Chemical composition of fly ash measured using X-ray fluorescence (XRF).
Elemental Oxide (wt%)
SiO2Al2O3Fe2O3K2OCaOTiO2Na2OMgOP2O5L.O.I
69.819.782.681.541.440.790.550.470.22.32
Table 3. Chemical composition of blast furnace slag measured using XRF.
Elemental Oxide (wt%)
CaOSiO2Al2O3MgOTiO2SO3Fe2O3Mn3O4K2ONa2OBaOWt. Gain
41.4935.2814.695.761.251.010.50.420.280.240.10.12
Table 4. Particle size distribution of fly ash (FA) and ground granulated blast furnace slag (GGBFS) particles.
MaterialAvg. Particle Size
(D[3,2], µm)
Avg. Particle Size
(D[4,3], µm)
D10 (µm)D50 (µm)D90
(µm)
FA7.837.04.522.883.7
GGBFS4.414.91.711.730.9
Table 5. Geopolymer mix design—Series A.
Series AFA (g)GGBFS (g)Na2SiO3 (g)H2O (g)Sand (g)
60/40/0.2515010062.5150500
60/40/0.3515010087.5150500
60/40/0.4150100100150500
50/50/0.2512512562.5150500
50/50/0.3512512587.5150500
50/50/0.4125125100150500
40/60/0.2510015062.5150500
40/60/0.3510015087.5150500
40/60/0.4100150100150500
40/60/0.25–11510015062.5165500
40/60/0.25–12010015062.5170500
40/60/0.35–11510015087.5165500
40/60/0.35–12010015087.5170500
40/60/0.4–115100150100165500
40/60/0.4–120100150100170500
Table 6. Geopolymer mix design—Series B.
Series BFA (g)GGBFS (g)Na2SiO3 (g)H2O (g)Sand (g)
45/55/0.2112.5137.550126500
40/60/0.1610015040126500
40/60/0.210015050126500
40/60/0.2410015060126500
35/65/0.287.5162.550126500
Table 7. Deconvoluted 29Si NMR peaks of 7-day cured geopolymer paste samples.
ID
(7 day)
Raw SlagCASHNASHQuartzMullite
45/55/0.2Site TypeQ1Q1Q2(1Al)Q2(0Al)Q3(1Al)Total CASHQ4(4Al)Q4(3Al)Q4(2Al)Q4(1Al)Q4(0Al)Total NASHQ4(0Al)Q4(0Al)
Pos. (ppm)−75.96−79.66−82.33−85.51-−89.18−96.05−101.27−106.12−112.55−109.12−115.66
FWHM4.162.922.373.37-4.398.123.176.393.982.541.89
Intensity14.3333.2184.8055.63-57.8815.5912.559.6625.0924.3417.2522.5716.94
Integral (%)5.488.9018.4617.23-44.596.299.362.8114.738.5441.735.262.94
35/65/0.2Site TypeQ1Q1Q2(1Al)Q2(0Al)Q3(1Al)Total CASHQ4(4Al)Q4(3Al)Q4(2Al)Q4(1Al)Q4(0Al)Total NASHQ4(0Al)Q4(0Al)
Pos. (ppm)−76.60−80.24−83.05−86.22-−89.41−95.74−99.69-−106.20−109.40−113.30
FWHM3.652.642.142.70-12.691.303.68-8.762.545.34
Intensity15.8150.23111.5158.43-73.3917.126.018.14-21.1213.1014.7821.49
Integral (%)4.911.2220.2713.39-44.8818.430.662.54-15.6837.313.189.73
40/60/0.16Site TypeQ1Q1Q2(1Al)Q2(0Al)Q3(1Al)Total CASHQ4(4Al)Q4(3Al)Q4(2Al)Q4(1Al)Q4(0Al)Total NASHQ4(0Al)Q4(0Al)
Pos. (ppm)−76.30−80.30−83.14−86.26-−89.97-−99.69-−107.45−109.64−114.40
FWHM3.753.312.112.73-12.49-5.43-9.372.544.93
Intensity15.5842.7098.1259.96-65.9315.66-8.38-25.8016.6118.0015.75
Integral (%)5.0012.1117.6913.30-43.1016.75-3.90-20.6941.343.916.65
40/60/0.24Site TypeQ1Q1Q2(1Al)Q2(0Al)Q3(1Al)Total CASHQ4(4Al)Q4(3Al)Q4(2Al)Q4(1Al)Q4(0Al)Total NASHQ4(0Al)Q4(0Al)
Pos. (ppm)−76.85−80.16−82.96−86.04−88.48−90.25-−103.06-−111.19−109.00−116.43
FWHM4.362.552.222.621.318.23-11.01-6.392.542.84
Intensity13.2347.72106.4165.669.6557.3617.39-17.08-19.9518.147.4911.33
Integral (%)5.2010.9721.2615.491.1448.8612.90-16.94-11.4941.331.722.90
Table 8. Deconvoluted 29Si NMR peaks of 91-day cured geopolymer paste samples.
ID
(91 day)
Raw SlagCASHNASHQuartzMullite
45/55/0.2Site TypeQ1Q1Q2(1Al)Q2(0Al)Q3(1Al)Total CASHQ4(4Al)Q4(3Al)Q4(2Al)Q4(1Al)Q4(0Al)Total NASHQ4(0Al)Q4(0Al)
Pos. (ppm)−74.42−81.44−82.85−85.70-−89.31--−104.51−109.77−108.18−116.34
FWHM3.538.222.111.92-12.26--12.149.431.476.15
Intensity8.0541.0540.3170.42-50.5936.73--20.820.7526.0914.648.68
Integral (%)1.8321.635.458.65-35.7328.89--16.212.5457.631.383.42
35/65/0.2Site TypeQ1Q1Q2(1Al)Q2(0Al)Q3(1Al)Total CASHQ4(4Al)Q4(3Al)Q4(2Al)Q4(1Al)Q4(0Al)Total NASHQ4(0Al)Q4(0Al)
Pos. (ppm)−76.36−79.84−82.69−85.71−86.86--−97.16−105.97-−109.15−113.63
FWHM4.602.882.312.4210.82--5.179.48-2.545.3
Intensity17.9245.0090.4480.2836.8563.14--10.5223.46-16.9917.4814.51
Integral (%)5.849.1714.7913.7828.2365.97--3.8515.75-19.603.145.45
40/60/0.16Site TypeQ1Q1Q2(1Al)Q2(0Al)Q3(1Al)Total CASHQ4(4Al)Q4(3Al)Q4(2Al)Q4(1Al)Q4(0Al)Total NASHQ4(0Al)Q4(0Al)
Pos. (ppm)−74.74−80.19−82.73−85.85−86.24−91.22−94.99-−105.88-−109.13−114.38
FWHM4.426.061.951.605.922.917.81-10.56-3.686.38
Intensity10.7244.6341.4939.5164.3647.5016.317.81-29.07-21.0617.2916.19
Integral (%)3.1517.985.384.225.3652.923.159.26-20.42-32.834.236.9
40/60/0.24Site TypeQ1Q1Q2(1Al)Q2(0Al)Q3(1Al)Total CASHQ4(4Al)Q4(3Al)Q4(2Al)Q4(1Al)Q4(0Al)Total NASHQ4(0Al)Q4(0Al)
Pos. (ppm)−77.20−80.17−82.96−85.83−88.52-−94.92-−106.00-−108.61−113.63
FWHM2.593.762.302.475.92-8.11-10.13-1.626.62
Intensity8.4646.08104.23106.0442.6574.75-20.52-25.68-23.1016.2719.00
Integral (%)1.4311.3415.7017.1716.5160.72-10.89-17.01-27.901.738.22
Publisher’s Note: MDPI stays neutral with regard to jurisdictional claims in published maps and institutional affiliations.

