The Northern Hairy-nosed Wombat (Lasiorhinus krefftii) is one of the most endangered mammals in the world, with an estimated population of 200 individuals in 2012 (DEHP). However, even more worrying is the genetic bottleneck that occurred in 1982, when there was only 30 wombats remaining. The lack of genetic diversity may threaten the Northern Hairy-nosed Wombat’s chance of survival in the future.
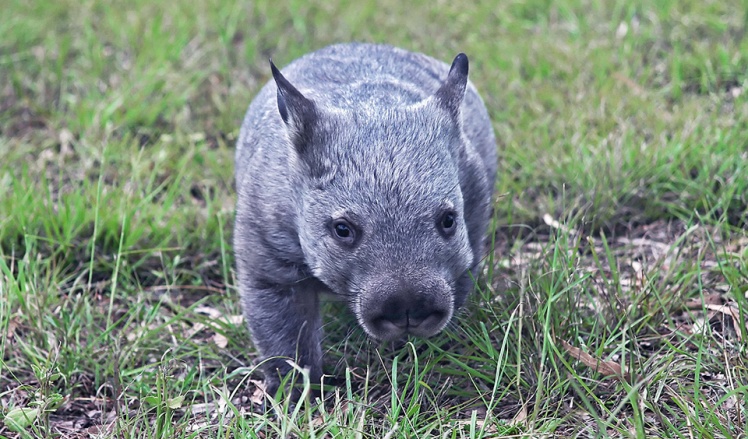
Photograph by Tina Janssen, used with permission.
Population Viability Analyses are used to calculate the chance that a particular species will go extinct over a certain period of time. VORTEX is one program used to model such ‘extinction vortices’. As I could only find one reference to a VORTEX simulation of Lasiorhinus krefftii (Hoyle, Alpers and Sherwin 1998), I created my own VORTEX simulation in order to determine which factors had the greatest impact on the chance of extinction. The simulation is available in xml format (the VORTEX program is necessary to run the simulation).
My report details the full findings; a summary is shown below. Supplementary materials, detailing how the simulation was created, are also available here.
ABSTRACT
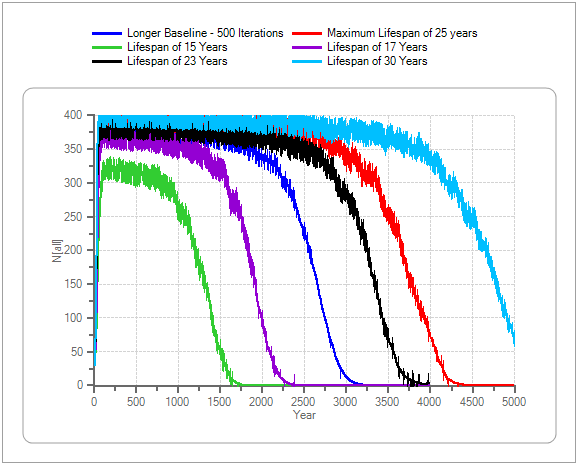
The Northern Hairy-nosed Wombat (Lasiorhinus krefftii) is one of the most endangered mammals in the world (Department of Environment and Heritage Protection [DEHP] 2016). The population viability analysis software VORTEX was used to model the effects of predation, initial inbreeding and maximum age on a population of Lasiorhinus krefftii. Initial inbreeding had a significant effect, with levels of 0.1 and 0.2 decreasing the median time to extinction by 17.2% and 53.0% respectively. Maximum age had almost as great an effect, decreasing the median time to extinction by 48.9% when the maximum age was decreased from 20 to 15 years, and increasing it by 41.4% when the maximum age was increased to 25 years. Accurately determining the current levels of inbreeding and the typical maximum age of Lasiorhinus krefftii will be necessary in order to create more accurate simulations.
Figure 1 – The effect of inbreeding on the median time to extinction
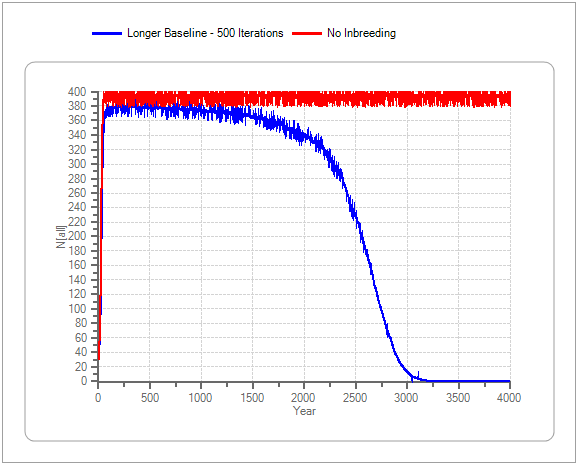
Figure 2 – The effect of the initial amount of inbreeding on the median time to extinction
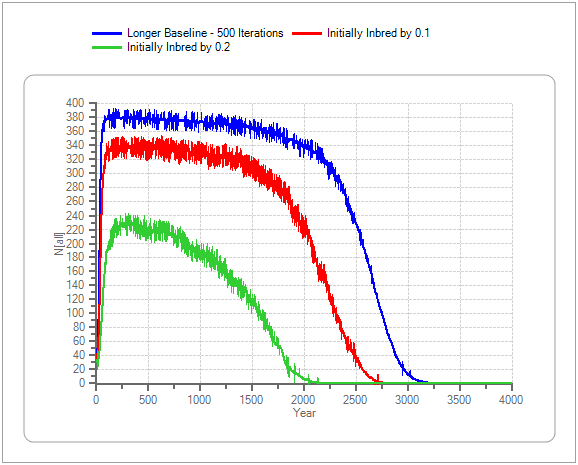
Figure 3 – The effect of continued dingo predation on the median time to extinction

Figure 4 – The effect of maximum age on the median time to extinction
Full details and analysis are found in the report.
Table 1 – A summary of the data collected
| Scenario | Run Time (yrs) | Median Time to Extinction (yrs) | Percent of Baseline | Change in Median Time to Extinction |
| Baseline | 4000 | 2820 | 100.0% | 0 |
| No Inbreeding | 4000 | 0 | 0.0% | 0 |
| Continued Dingo Predation | 4000 | 2530 | 89.7% | 11.3% decrease |
| Initially Inbred by 0.1 | 4000 | 2336 | 82.8% | 17.2% decrease |
| Initially Inbred by 0.2 | 4000 | 1324 | 47.0% | 53.0% decrease |
| Lifespan of 15 Years | 4000 | 1441 | 51.1% | 48.9% decrease |
| Lifespan of 17 Years | 4000 | 2039 | 72.3% | 27.7% decrease |
| Lifespan of 23 Years | 4000 | 3535 | 125.4% | 25.4% increase |
| Lifespan of 25 Years | 5000 | 3986 | 141.4% | 41.4% increase |
| Lifespan of 30 Years | 5000 | 4995 | 177.1% | 77.1% increase |
